


TECH TUESDAY is a weekly content series covering all aspects of capital markets technology. TECH TUESDAY is produced in collaboration with Nasdaq.
Based on our study of buy-side trade costs, we estimated that every basis point of shortfall adds around $2.2 billion in mutual fund investors’ trading costs. With spreads contributing significantly to buy-side trade costs, improving the NBBO is important.
Others have suggested retail might also do better with a less segmented and tighter market-wide NBBO.
However, buy side and retail both do a lot of their trading “off-exchange.” That means the market makers on exchange don’t earn spreads from a lot of retail and buy side trades. That probably seems unfair (to the market makers) providing those spreads, which might disincentivize them from quoting.
It raises an important economic question: Do retail and buyside investors provide economic incentives to the tight spreads they benefit from?
It turns out there are two big ways they do.
Rebates reward quotes that trade
The most explicit way that the market economically rewards quote setters who provide liquidity is with rebates.
Data consistently shows that exchanges offering rebates to liquidity providers have far more competitive quotes and tighter spreads that set the NBBO more often. That’s especially important for many of the smaller “growth” companies in the market, where fewer shares trade and spreads are naturally more expensive. As Chart 1 shows, with over 10,000 Reg NMS securities, attracting competitive quotes across all those stocks is hard, even with rebates.
Chart 1: Rebates clearly help keep NBBO competitive and spreads tight, which is especially important for thinly traded stocks where attracting quotes is harder
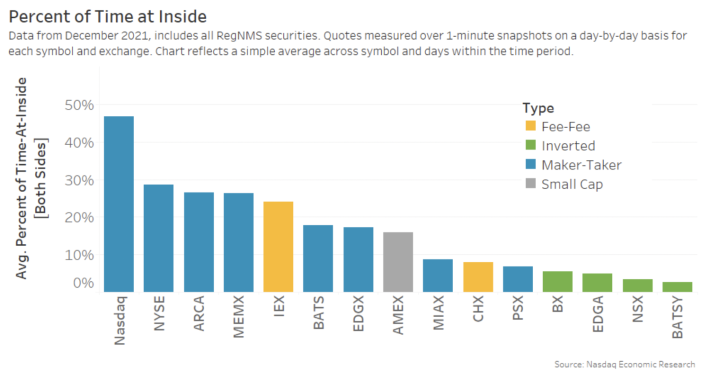
Importantly, rebates are earned by participants (not exchanges) and only on quotes that trade (real liquidity). Consequently, rebates directly reward providers of prices AND liquidity, while a quote that fades will earn nothing.
From an economic perspective, the reward to providers of liquidity is clear.
But there are inefficiencies in who pays. That’s because on-exchange takers pay all the take fees. In contrast, those who trade off-exchange still pay nothing. That results in on-exchange takers absorbing an unfair share of the burden of incentivizing tight spreads, while off-exchange trades benefit from rebate-incentivized tighter spreads without paying any take fees.
SIP accounting charges all users to incent better quotes
The SIP works very differently and somewhat offsets the economic distortions noted above.
The most important difference is that the SIP collects revenues from most data users. That means retail, mutual funds companies, and non-exchange venues contribute to the SIP revenues.
The SIP is also collected based on a tiered rates schedule that acknowledges the different value that various users get from market data:
- It is cheap for non-professionals who trades very little: a single quote request costs less than one cent.
- It is capped for non-professionals who trades a lot: All quotes all the time cost $3/month.
- While professionals who earn income from advising investors pay more for the same data: All quotes all the time cost up to $92/month.
- But computers, which can trade for thousands of investors at once, and make significant trading profits, pay a higher $9,500/month.
- There are even rates for businesses, like media, which profit from showing market prices but don’t do any trading.
Those rates have changed little over the years. The data suggests that the uptick in retail trading has been mostly offset by declines in professional users. Despite inflation during this time, SIP revenues are roughly the same as they were over 10 years ago.
Chart 2: SIP revenues, grouped by type of investors who pay them, have changed little over 10+ years
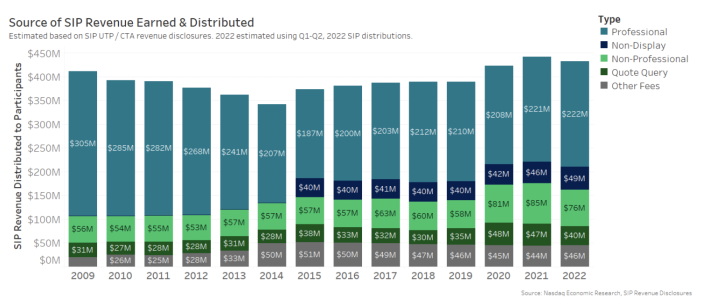
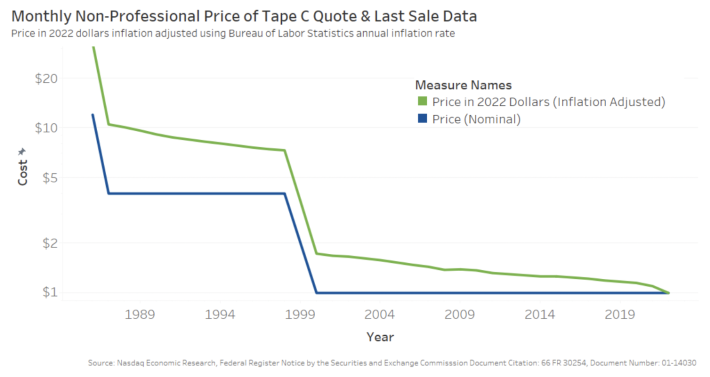
In fact, inflation-adjusted SIP revenues allocated to the exchanges in Chart 2 fell 23.7% between 2008 and 2018, while the cost of data for retail has fallen over 96% since 1987.
Chart 3: SIP cost of data has declined over 96% since 1987
While the SIP does a better job at charging actual users, it does a worse job of directly benefitting participants who provide NBBO quotes and firm liquidity. Here is how it (basically) works:
- Because quotes are important to set tight spreads, but trades are important because they represent liquidity (and sometimes off-exchange and “dark” price discovery), SIP revenues are split 50:50 between quotes and trades.
- Each venue is allocated a proportion of the total revenues based on their share of the data in each (quoting and trading) bucket.
- Exchanges with more NBBO quotes will earn more than exchanges with no quotes. All venues, including the TRF, are rewarded for trades they do.
If you’re interested, there are some more details in one of our older studies here, including how the formula also rewards quotes in thinly traded stocks more than liquid stocks.
Does paying for quotes make a difference?
SIP accounting creates two different economic distortions:
- Quote revenues are returned to venues based on quotes, not necessarily quotes that lead to actual liquidity for investors needing to trade more urgently. That can result in millions of dollars being allocated to fading quotes or quotes investors are unlikely to hit.
- Around 35% ($64 million on average per year) of trading revenues are returned to the TRF, too, for all the off-exchange trades, which mostly make their way to the OTC market centers executing those trades and reporting them to the TRF. Effectively rewarding those venues for keeping trades off the NBBO.
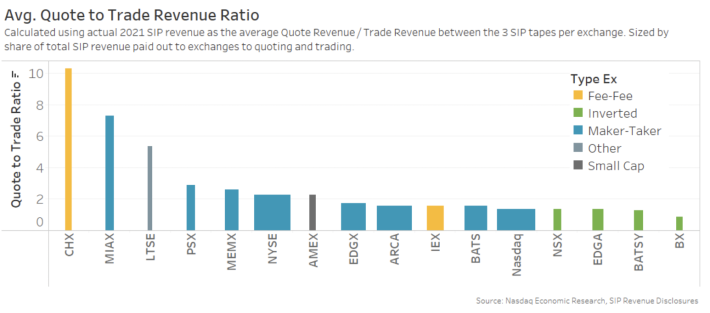
It’s possible to see some of this just by looking at the ratio of quote to trading revenues. A 1:1 ratio (Chart 4) would indicate that the trading was proportionate to your quoting.
The data shows that inverted venues (green) have trade revenues very close to their quote revenues, despite their lack of market share. Meaning they don’t quote much, but when they do, it often results in a trade.
Most of the larger venues (blue, thicker line) also sit closer to a 1:1 ratio of quotes leading to trades. Importantly, from an economic perspective, many of those venues run platforms that offer larger rebates than take fees, thereby sharing SIP revenues directly with investors making those quotes that lead to trades.
However, some venues quote at the NBBO a lot but trade relatively little, indicating these quotes don’t align with actionable volumes or true inside markets (where odd lots are more prevalent). That seems to highlight an inefficiency in the allocation of quoting incentives from an investor’s perspective.
Chart 4: Most large exchanges have quote revenue close to trade revenues
How have rewards changed in the past few years?
Clearly, the SIP tries to create a model that very equally rewards all quotes and trades. One other outcome of this is that increased competition (or fragmentation) tends to quickly add variable revenues to new venues – regardless of the economic fixed costs of the industry connecting and routing to more venues.
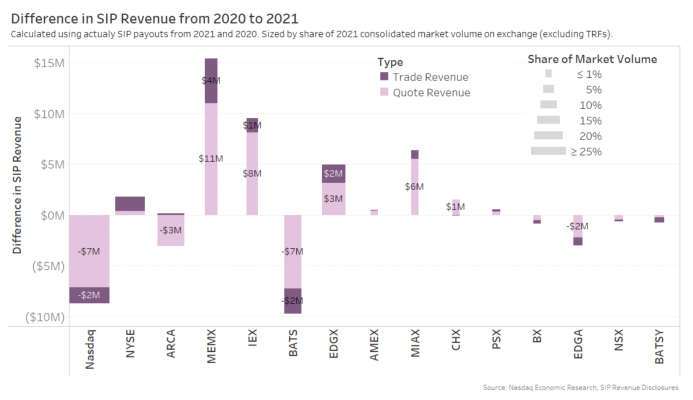
We can see that in the shift to revenue allocations in the past year (Chart 3). New exchanges MEMX and MIAX are already earning millions in SIP revenues, especially quoting revenues (light pink).
Conversely, IEX has also significantly increased quoting revenues without much change in their trading due to the approval of their D-Limit order type – which (by design) pegs to price-setting exchanges quotes but fades incoming investors before trades can occur.
Chart 5: Change in lit-venue quote and trade revenues over the past year show the quoting revenue gains to new entrants and D-limit
What does this all mean?
Data suggests those who trade mostly off-exchange receive the benefits of tight spreads made possible by the NBBO, saving them billions of dollars in trading costs each year.
However, there is a disconnect between investors who benefit and those who pay for high tight spreads and concentrated actionable liquidity.
Although rebates directly reward quotes that trade – many investors are easily able to avoid paying participants who provide the quotes they benefit from.
The SIP does a better job of making sure all investors pay in proportion to the benefits they receive. But its allocation formula seems to encourage inefficient programs with debatable investor benefits –fading quotes and unactionable liquidity – and arguably not allocating enough dollars to markets that materially improve firm-quote behavior.
We all agree NBBO is important. But a good NBBO doesn’t come for free. It’s all in the economics.

Phil Mackintosh is Chief Economist and a Senior Vice President at Nasdaq. His team is responsible for a variety of projects and initiatives in the U.S. and Europe to improve market structure, encourage capital formation and enhance trading efficiency.


