|
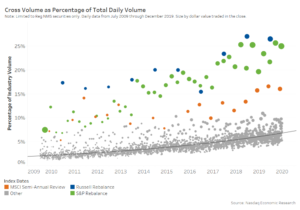
People often link the increasing importance of the close with the growth of index funds. However, index funds are likely only a (small) part of the phenomenon. Index funds trade when they’re told to Index funds need to trade at exactly the same time as the “virtual trade” that an index itself performs in order to perfectly track the index and thus minimize tracking error. That means trading at market close (MOC). Given their risk aversion, as tracking errors on index funds are incredibly low, that’s likely how most trade. Importantly though, most indexes rebalance on very specific days, as Chart 1 shows. The green, orange and blue circles represent days with scheduled index rebalances. Notably: Green dots: These represent the dates that S&P and FTSE performed quarterly reviews, as well as the Nasdaq-100’s annual review each December. These index providers intentionally rebalance on so called “quad witch” dates, where options and futures also expire, because of the additional liquidity available in close auctions from derivatives market hedges. Importantly, S&P does not typically make additions and deletions during its quarterly reviews. Instead these are done as-needed, on dates where companies are removed from indexes due to corporate events like takeovers. Blue dots: Russell reconstitutes its indexes annually on or close to the last Friday in June (they try to avoid quarter end because market impact from the rebalance can unnecessarily impact index performance). Although Russell also adds new IPOs quarterly, the annual reconstitution includes promotions, demotions, deletions, and style and float changes for over 3,000 stocks, making it the “largest” single trading day each year. Orange dots: MSCI’s indexes perform a quarterly rebalance that includes additions, deletions and float changes on a completely different schedule. Typically this is held the last day of the middle-month of each quarter (although they try to avoid the Friday after the U.S. Thanksgiving). As is clear from this data, MSCI is much less significant to U.S. stocks. That’s because MSCI is a more international index, with less U.S. assets tracking their U.S. indexes. There is a clear upward trend in all colored dots. In fact, most have roughly doubled, in line with the growth in index assets (Chart 2). However, the grey dots, which represent “normal” closes, typically have no index rebalance activity (except on the handful of dates when S&P makes replacements due to corporate actions). Despite that, the grey dots are also trending up, and have almost doubled. Chart 1: Index rebalance closes are much larger than typical MOC days
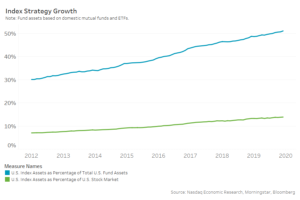
Don’t Index funds need to rebalance for price moves during the day? The simple answer here is: No. The clever feature of market cap weighted indexes is that on a “normal” day, index funds don’t need to trade. That’s because as a stock’s price goes up, its weight in the index and the index fund go up by the same amount. So at the end of the day, the fund does not need to trade as all stocks remain at “index weight.” What about daily cash flows? In order to minimize tracking error, yes, daily cash-flows are also likely to be invested at the close. Importantly, this excludes ETFs, who receive cash flows via creations. Creations are a result of stock trades executed during the day at times when arbitrage opportunity exist. The creation itself is a “stock-for ETF-swap” so no MOC trading occurs. The data indicate that index cash-flows are a relatively small proportion of MOC trading. A study by Blackrock in 2017 estimated that indexes trade around $460 billion each year. We estimate that cash flows add to around 5.5% of a normal close, given: Adjusting for market valuation increases and inflows into index funds since 2017, we estimate this number could have increased to around $600 billion. But Credit Suisse recently estimated that US index rebalance date trading accounted for just over $300 billion in index trading last year. Interestingly, the data in the chart show that index rebalance dates had close notional in 2019 of $725 billion, making index funds over 41% of MOC flows on those days. What Credit Suisse estimate also leaves just $300 billion in cash-flow trading for “normal” close days, which we highlight is consistent with other reported data. Given the “normal close” is around $23 billion per day, and there are 245 “normal” close days. Making index funds shrink to just 5.5% of trading in those closes. Causation vs correlation? So what is causing the “normal close” to increase? It is true that index funds are also growing at around the same rate as MOC size, having roughly doubled since 2009. In 2019, Morningstar reported that index fund assets had passed active assets for the first time (although this excludes pension fund assets which may be actively managed). Chart 2: Index funds are becoming a larger proportion of total assets and the shareholder base.
That’s not necessarily bad for corporates. Indexers represent “long-term holders” thanks to the way index providers construct their benchmarks. But the fact that these are happening together doesn’t mean index funds are causing the increase in the close. In fact, the data show there are a lot of other investors, traders and hedgers who are also using the close because it’s a cheap way to get sizable liquidity with minimal market impact. That’s consistent with what our other studies have shown, where public imbalance information helps create a competitive and fair MOC market. Although the SEC’s approval of Cboe’s Market Close promises to leak this valuable imbalance information to select investors ahead of the market in the near future. |