


As indexes like the Nasdaq Composite and Nasdaq-100 hit all-time highs, there are many signs that the economy is on the road to recovery.
Retail sales are increasing, hiring and small business confidence have bounced, and bookings for restaurants, flights and hotels are trending back up, although admittedly from very low levels.
Market volatility has fallen back to more normal levels
At the same time, market volatility, volumes and bid-offer spreads have fallen.
The VIX (expected volatility in one month) has fallen around 70% from its highs around 80. Realized (actual) volatility in the market has fallen even more. Short term realized volatility (past five days) peaked over 140% back in March, as we saw four market wide circuit breakers and thousands of single stock halts on multiple days. It recently dropped below 10. The 21 (trading)-day realized volatility, which is more consistent with the VIX’s one-month forward metric, has now fallen back below the VIX. That’s another sign that markets are much more “normal” now.
Chart 1: Stock Market volatility has normalized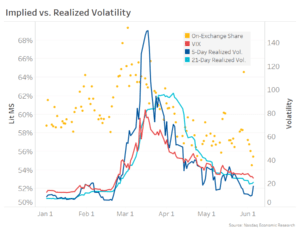
Good conditions for the IPO market to recover
We also saw a dramatic fall in the number of IPOs in March.
That’s not surprising given that we saw the fastest bear market in history. Importantly though, equity capital markets didn’t completely freeze up. There were still secondary capital raisings and select IPOs during that time, although many of the companies that did raise capital were in some way affected by the challenges and changes that COVID-19 and lockdowns created.
Data also shows that’s completely normal. We usually see IPOs fall in the months of dramatic selloffs. However, the data also shows that the IPO market also recovers, sometimes quickly, once volatility returns to “normal” levels.
Chart 2 shows that when the VIX spikes (blue line, scale inverted), typically the level of IPOs falls (bars). The chart also shows that the return of IPOs can be sharp, especially when the VIX returns to normal and the market recovers (green bars) quickly.
We are already seeing all of that happening in 2020.
Chart 2: IPO levels vs. monthly market returns and VIX levels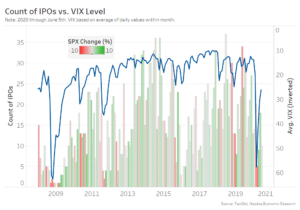
Another way to look at the same data is to plot each month as a dot on a scatterplot. That shows more clearly that although the data is noisy (scattered), the VIX crossing 25 is significant because:
- Strongly negative returns (red circles) are much more likely with the VIX over 25.
- IPOs return to normal levels (vertical height) with the VIX below 25.
Despite this relationship, the data also shows IPOs rarely completely stop. That’s another reason why it’s important to keep markets open even when portfolio returns are negative.
Chart 3: IPO levels vs. monthly market returns and VIX levels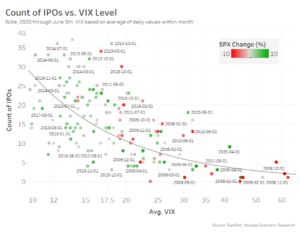
Nasdaq leading the IPO market year-to-date
The slowdown in the IPO market in March put us behind the run-rate of the past two years. But, as the stock market and the economy recovers, so has the IPO market started to recover.
Year-to-date, the market brought 76 new companies to market, adding around $22 billion in new market capitalization. Continuing our trend from last year, Nasdaq represents well over half of these companies (49) and assets raised.
Chart 4: IPO raisings over time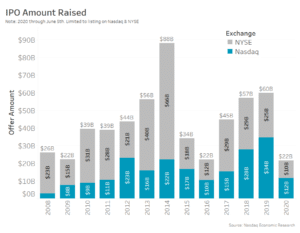
Some of last year’s IPOs, like Zoom (ZM) have been invaluable tools in the COVID-19 quarantines. Many other new-economy companies have helped to drive the Nasdaq back to record levels.
That’s good for investors and employees in those companies. It’s also good for U.S. households and the U.S. equity markets.
The views represented in this commentary are those of its author and do not reflect the opinion of Traders Magazine, Markets Media Group or its staff. Traders Magazine welcomes reader feedback on this column and on all issues relevant to the institutional trading community.