


As volumes and volatility spiked during the height of the COVID selloff, ETFs reached over 40% of total market value traded. At their peak, on February 28th, ETFs traded $405 billion in one day. But other data suggests ETF trading affects underlying stocks a lot less than you’d expect. For example, on February 28, creations and redemptions totaled a much smaller $18 billion gross, and the underlying stock market traded an additional $588 billion.
Chart 1: ETFs make up 30% of all value traded, even more when volatility spikes

That’s not uncommon during bouts of volatility or macro news, and it highlights how useful ETFs are for investors looking to position quickly and cheaply to new macro news.
The other thing that we’ve highlighted before is that ETFs are getting more active, with many new ETFs representing smart beta or thematic exposures rather than classic broad market indexes.
Learning from wisdom of ETF crowds
In addition, holdings data shows ETFs are a popular tool for a range of investors from retail to hedge funds and banks.
Given how many investors are trading ETFs, and how actively some of them trade, we believe the different tickers that are most active can tell us a lot about sentiment over time.
We’ve been screening the full 2,000-plus ETF universe to see what ETFs are the most interesting to investors. We look at what tickers are trading the most (absolutely and relatively), moving the most (%) and seeing the most flows. We create a score for each factor, then aggregate those scores. If we then rank that combined score we can see what ETFs have the most elevated activity for a specific period.
In Table 1 below, we break the COVID period up into the selloff (red dates) and recovery (green dates). There are some interesting trends even just looking at tickers.
As the market sold off, many (but not all) of the most active ETFs saw outflows. Despite that, data shows mutual fund outflows were far larger than industry-wide ETF redemptions.
In both phases, the energy complex, including oil and MLPs, were extremely active. As the economy shutdown demand for energy fell, oil prices fell and hurt energy sector margins. But once oil supply was reduced to better match new demand levels, oil prices and industry margins recovered. Our ranking shows a lot of activity trying to price-in all the emerging news.
The market recovery also shows mostly inflows, many in stocks positioned to benefit from the new “work from home” environment. From cloud computing and online retail to semiconductors and other internet ETFs.
Table 1: New economy ETFs standout in the recovery
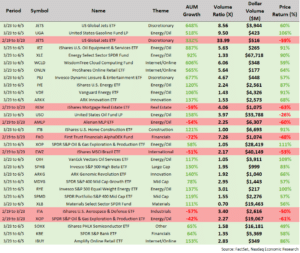
These themes played out at different times throughout the crisis
If we break this ranking down by week, we see even more details of how trends evolved as news emerged throughout the COVID crisis.
The data in Chart 2 groups the flows in our “Top 25” most active ETFs each week by some common thematics. It’s an interesting ride through the rollercoaster markets we have seen.
Chart 2: ETFs highlight trends that evolved throughout the crisis
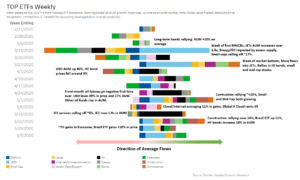
Although businesses didn’t shut down until mid-March, the market volatility spiked at the very end of February. In fact, Feb 28 is still the record for value traded in a single day, at just under $1 trillion.
But outflows didn’t really pick up until the middle of March, and when they did, they were widespread. Only the airline ETF saw creations, and that may have been to allow hedge funds to short the sector as the survival of airlines globally was called into question (see more on JETS below).
As the rate of market-wide liquidation increased, and data showed around 50% of U.S. businesses were shutdown, even bond ETFs started to see outflows. Although they continued to trade with pretty competitive spreads, arguably providing more liquidity and pricing than the underlying bond markets. Despite market-wide liquidations, corporate bonds rallied with inflows on the news that the Federal Reserve would be buying bond ETFs to support the broader market. It wasn’t until weeks later that they actually started.
Credit risks also affected financials valuations, with concerns that a prolonged shutdown would lead to bad debts and defaults. Banks reported large loss provisions in their Q1 earnings and financial ETFs were active and net to sell.
During the “recovery” period (from the week ended March 27), money mostly shifted back into ETFs, starting with a couple of weeks of strong interest in ETFs with internet or online exposures (in other words, “New Economy” companies), themes from cloud computing (Nasdaq: WCLD, SKYY, CLOU) to online retail (Nasdaq: IBUY) all entering our ranking. By the end of that time, we saw the Nasdaq QQQs back to positive returns for the year and more than 10% ahead of other large cap indexes.
April was also when front month oil futures expired at negative prices. Although the Oil ETF (USO) survived thanks to positions that were already rolled, the fall in the price of oil was really driven by fundamentals. Not only was demand down around 10% globally, but Russia and Saudi Arabia entered a price war that added to supply. Prices for land- and sea-based oil storage spiked and were expected to be at capacity within weeks. The global glut of oil depressed prices, which squeezed the margins of drillers and increased default risks on high-yield bonds with energy exposure. Unsurprisingly, the whole energy complex was active, from oil to producers and refiners to MLPs.
In May, the news cycle started to slow, new COVID cases started to fall globally and small positive stories about vaccines and returning to work boosted markets. Overall, the data was surprising to the upside, increasing the expectations for interest rate normalization and economic growth returning. Small cap and value ETFs, which had sold off even worse than the market, staged a short recovery. Financials also recovered as it was expected that bad debts would be lower than first expected.
Intermittently throughout the cycles, healthcare and biotech ETFs, especially those that may benefit from vaccines and therapies, saw (mostly) inflows.
And throughout May, as many states reopened and people returned to work, construction and homebuilder ETFs were active with inflows. At the same time, many emerging market ETFs saw increased activity as new COVID cases started to spread through those economies.
Two (of many) tickers take flight
It’s hard not to talk about JETS (the global airlines ETF with 80% U.S. exposure), right at the top (No. 1 and No. 3) of our ticker rank for the period.
As we noted above, the aviation industry was especially affected by shutdowns. Flight activity fell 95% with many international flights banned. That led to schedule reductions, hundreds of planes being idled and a $25 billion bailout specifically for airlines. Data from China shows even as the economy recovers, long-distance public transport has lagged. The Airlines ETF (JETS) therefore represents a leveraged play on the COVID recovery. Airline valuations fell making the ETF a deep value play.
But that also made the upside larger, especially if the recovery turned out to be more V-shaped than expected. This ticker encapsulated so many COVID themes at once.
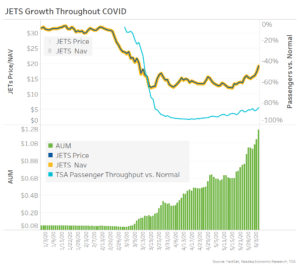
As airlines sold off over 50%, AUM in JETS increased more than 600% and trading activity grew almost tenfold (Table 1). Then as the recovery started, even more assets flowed in and liquidity increased to around 34-times normal (Chart 3).
Importantly, throughout this time, ETF market makers kept the JETS ETF prices very close to net asset value (although spreads in the ETF and the underlying both widened).
Chart 3: Investors poured money into JETS throughout COVID
Many “new economy” tickers that also saw inflows
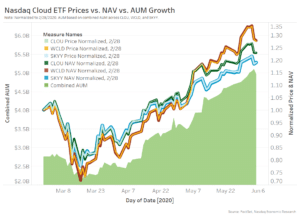
Some of the top Nasdaq-listed new economy ETFs included WCLD, SKYY, and CLOU.
Those ETFs include companies like ZM, DOCU and CRWD [WCLD], AMZN, MSFT, and GOOG [SKYY] and COUP, NFLX [CLOU]—all well positioned to benefit from our new work-from-home environment.
As the market recovered, assets in WCLD gained over 600%, while liquidity increased more than sixfold (Chart 4, Table 1). Assets in SKYY and CLOU also more than doubled (Chart 4).
Again, despite the strong inflows and trading activity, the ETF prices remained very close to net asset value providing cheap and easy exposure to the theme for investors.
Chart 4: Investors bought many new-economy ETFs, including WCLD, SKYY, and CLOU
ETFs were a boon for investors during the COVID period
It’s revealing how many thematic and active-like ETFs there are now. This data also shows how that level of choice allowed investors to focus their trades and exposures throughout the recent market stresses.
It’s also important that despite bond market stresses and Fed rescues, ETFs remained consistently liquid and tradable. Many of the worst fears about ETFs in a selloff have been well and truly stress tested. Those myths should now be busted.
Instead we saw how flexible and effective ETFs can be for all sorts of investors these days.
The views represented in this commentary are those of its author and do not reflect the opinion of Traders Magazine, Markets Media Group or its staff. Traders Magazine welcomes reader feedback on this column and on all issues relevant to the institutional trading community.
