


Commentary by Tom Roseen, Senior Research Analyst, Refinitiv Lipper
Data/charts by Refinitiv Lipper, an LSEG business
What a difference a few months can make. After suffering their worst calendar-year returns since at least 2008, the average equity and taxable fixed income fund is up 6.85% and 2.50%, respectively, year to date through the Refinitiv Lipper fund-flows week ended February 8, 2023.
On the equity side, the world equity funds macro-classification (+7.69% YTD, including ETFs) remained at the top of the leaderboard. Recall that despite dismal 2022 returns, for Q4 2022, equity funds posted their strongest quarterly returns since Q4 2020, with world equity funds (+12.85%) outpacing the other broad-based equity macro-classifications for the first time since Q3 2020.
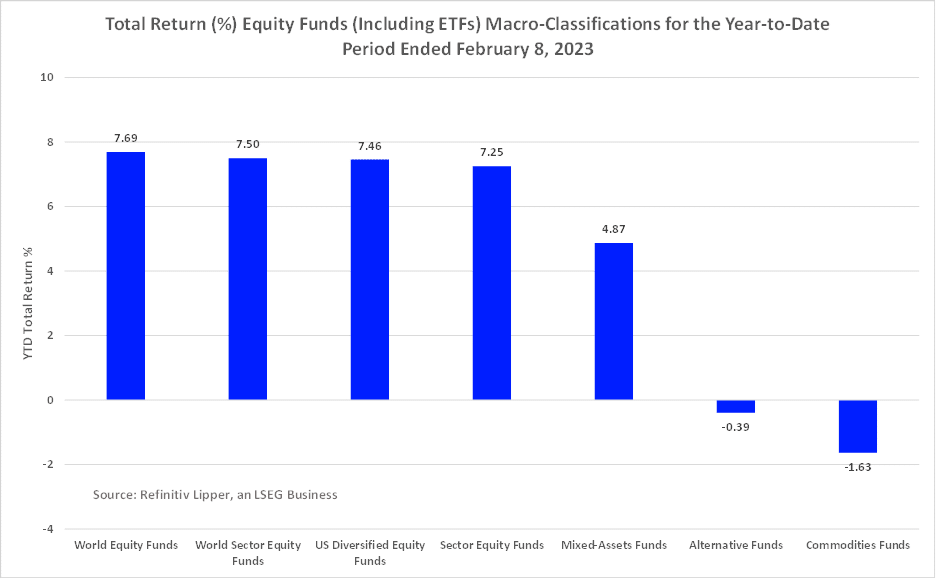
That trend has continued into 2023. With the dismantling of the strict zero COVID-19 policies in China, the reopening of its economy, and supply chain bottlenecks disappearing, the China Region Funds (+9.97%) classification witnessed the strongest YTD returns so far this year, followed by Global Multi-Cap Growth Funds (+9.47%), Global Large-Cap Growth Funds (+9.40%), and European Region Funds (+9.29%). Over the last few months, investors have begun to embrace some of the more out-of-favor issues from last year and recently started retesting the waters of tech- and growth-oriented issues—which were among the biggest losers in the equity funds universe for 2022.
As might be expected during a market rally that has recently favored technology and growth issues, Global Science & Technology Funds (+17.71%) posted the strongest returns in the equity universe year to date, followed by Equity Leverage Funds (+17.49%), Science & Technology Funds (+14.76%), and Consumer Services Funds (+14.53%).
At the bottom of the pile, the Dedicated Short Bias Funds (-13.11%) classification posted the only YTD negative returns in the alternative funds macro-classification (-0.39%), dragging the group average into negative territory. With front-month crude oil future prices declining 2.23% YTD, it was not too surprising to see Commodity Energy Funds (-4.85%) posting the next weakest returns in the equity universe, followed by the short and/or leveraged focused Commodities Specialty Funds (-2.70%).
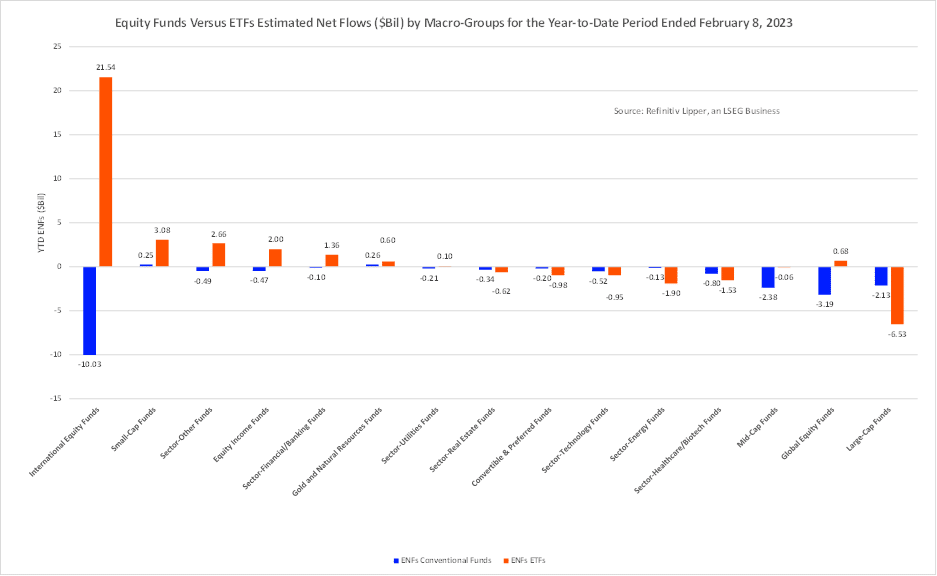
Investors have been net redeemers of equity funds and ETFs so far this year, withdrawing a net $1.0 billion in 2023. However, as has been highlighted over the last several years, there was a stark difference in estimated-net flows between conventional equity mutual funds and ETFs. Fund investors withdrew a net $20.5 billion from conventional equity funds, while injecting a net $19.5 billion into equity ETFs.
From a flows perspective, investors appeared to favor the out-of-favor issues mentioned above as well, with the international equity funds (including ETFs) macro-group (+$11.5 billion) attracting the largest net inflows YTD, followed by small-cap funds (+$3.3 billion), the commodities heavy, sector-other funds (+$2.2 billion), and equity income funds (+$1.5 billion).
Large-cap funds (-$8.7 billion) suffered the largest net redemption of the group YTD, bettered by global equity funds (-$2.5 billion), mid-cap funds (-$2.4 billion), and sector-healthcare/biotech funds (-$2.3 billion).
Despite the Federal Reserve Board hiking its key lending rate by an expected 25 basis points (bps) on February 1, the 10-year Treasury yield has declined 25 bps since year end to close on February 8 at 3.63% as longer-term inflation expectations have begun to wane—a boon for longer-dated fixed income securities. That said, the one-month Treasury yield has risen 52 bps since year end, to close at 4.65%, as Fed officials continue to reiterate their strong commitment to fighting inflation. Nonetheless, investors have begun putting a bit more risk-on and longer dated securities into their fixed income sleeves of their portfolios.
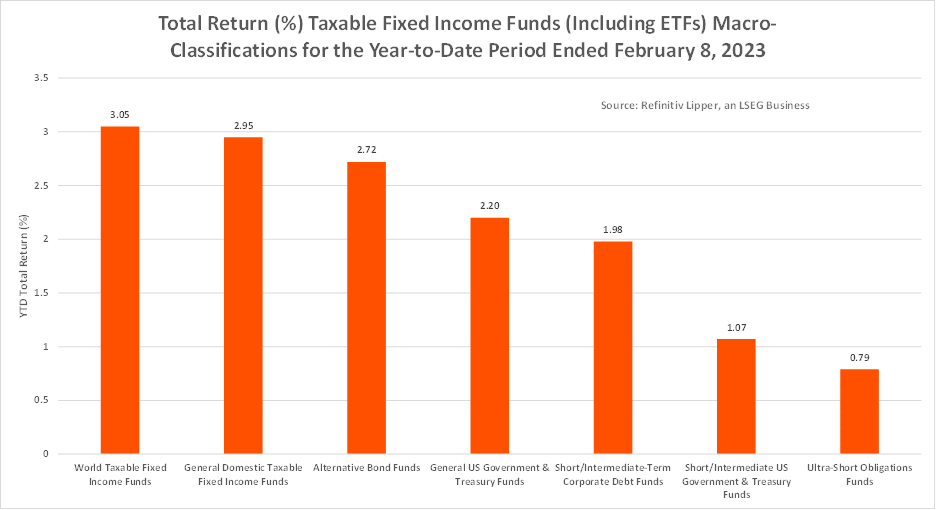
On the fixed income side, the world taxable fixed income funds (+3.05%) macro-classification posted the strongest year-to-date return of the fixed income macro-classifications, followed by general domestic taxable fixed income funds (+2.95%) and alternative bond funds (+2.72%). Much like the equity review above, investors appeared to bid up the out-of-favor and more risk-seeking fixed income instruments.
With a related weakening of the U.S. dollar so far this year, the Alternative Currency Strategies Funds (+8.50%, including ETFs) classification posted the strongest YTD returns, followed by Flexible Income Funds (+5.21%), Global High Yield Funds (+3.79%), and High Yield Funds (+3.72%).
While none of the major taxable fixed income macro-classifications witnessed negative returns, short-duration and government-related issues didn’t fare as well, with the Short U.S. Treasury Funds (+0.39%) classification posting the weakest YTD returns, bettered by Short U.S. Government Funds (+0.48%) and Ultra-Short Obligation Funds (+0.79%).
Investors injected a net $34.2 billion and $7.4 billion into taxable and tax-exempt fixed income funds (including ETFs) so far this year—quite a contrast to the record $237.4 billion and $125.4 billion in net outflows, respectively, witnessed in 2022.
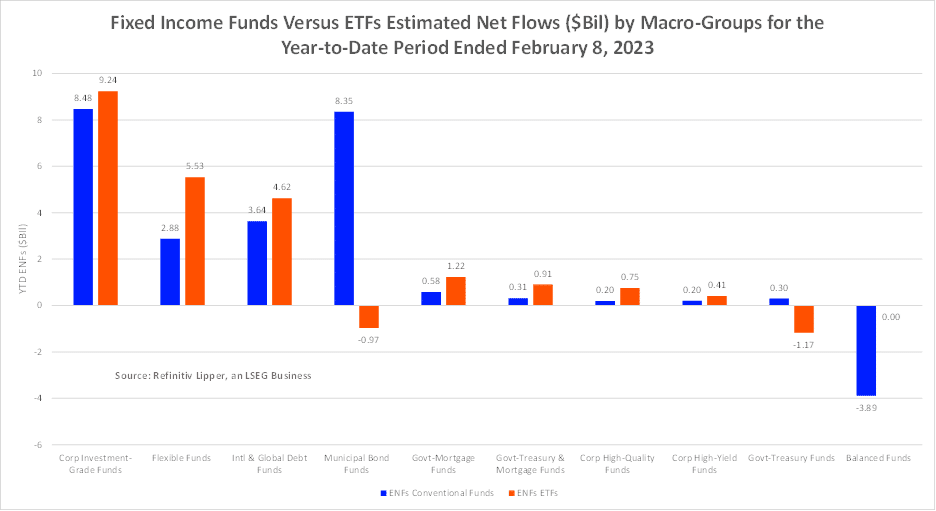
However, unlike what we saw in the equity universe, flows into conventional taxable bond funds (+$12.7 billion) and ETFs (+$21.5 billion) weren’t as lopsided, but still favored ETFs. However, on the tax-exempt side of the ledger, investors injected $8.4 billion into conventional municipal bond funds while being net redeemers of municipal bond ETFs (-$973 million) so far this year.
Investors moved back into the corporate investment-grade bond funds (including ETFs) space, injecting the largest amount of net new money (+$17.7 billion) of the taxable fixed income macro-groups year to date, followed by the flexible funds (+$8.4 billion) macro-group, international & global debt funds (+$8.3 billion), and government-mortgage funds (+$1.8 billion).
Balanced funds (-$3.9 billion, including ETFs) and government-Treasury funds (-$875 million) were the only macro-groups to experience net outflows year to date in the taxable fixed income universe.
For the fund-flows week ended February 8, 2023, the average equity and fixed income fund (including ETFs) declined 2.41% and 1.22%, respectively, as investors were jolted by a stronger-than-expected nonfarm payrolls report, which put the idea of a Fed pivot to a more dovish interest rate policy on hold—at least in the short run, with several Fed officials doubling down on their views that more interest rate hikes will be necessary to bring inflation down to the Fed’s 2% stated target.
The U.S. Bureau of Labor Statistics reported the U.S. economy added 517,000 jobs in January, crushing analysts’ expectations of 187,000. The unemployment rate declined to 3.4%, its lowest since 1969, fanning concerns the Fed will need to be more aggressive hiking rates in its battle against inflation than is already baked into market returns.
For the fund-flows week, investors were net sellers of fund assets (including those of conventional funds and ETFs) for the second consecutive week, withdrawing a net $11.5 billion. However, the headline numbers were a bit misleading. Fund investors were net purchasers of taxable bond funds (+$3.8 billion), tax-exempt fixed income funds (+$775 million), and equity funds (+$111 million), while being net redeemers of money market funds (-$16.2 billion) for the week.
Nonetheless, investors will be keeping a keen eye on inflationary signals, the rest of the Q4 earnings season and guidance, and Fed official comments in the near term as they try to measure the direction of the market and economy for the remainder of 2023.
Source: Refinitiv, an LSEG business