


TECH TUESDAY is a weekly content series covering all aspects of capital markets technology. TECH TUESDAY is produced in collaboration with Nasdaq.
Last year turned out to be the year of the recession that never came, even though, at times, it seemed like one was looming. Remember the regional bank crisis… or the debt ceiling showdown risking the U.S. defaulting on its debt and leading to Fitch’s downgrading the U.S. debt rating… or the spike in U.S. 10-year rates above 5% as markets worried about debt levels and government spending?
Looking at the data now, it seems most of the supply and demand stresses caused by Covid have finally faded. Employment has returned to more “normal” levels and inflation has been falling (quickly).
Chart 1: Supply chains are fixed; inflation is falling quickly and is expected to end 2024 near 2%

That all left one big question for markets: How high would Fed rates peak?
Now, it seems we have our answer: 5.25% to 5.50%.
2024 will be about rate cuts: How soon and how many?
Given the slowdown in much of the data, the big questions for 2024 will be when rate cuts will begin and how low they will go.
Right now, markets are pricing the first rate cut by April and 150bps in cuts by the end of 2024, getting short-term rates down to 4.0%.
Chart 2: Rates are expected to fall in 2024, too, although not back to near zero

That’s consistent with falling inflation and a soft landing for the economy, where growth remains positive and unemployment low. But far from the near-zero interest rates we saw before Covid.
GDP forecasts say a slowdown, not a stall
A number of factors are now supporting a soft landing. Real wages are increasing, supporting consumer spending, even as Covid savings run down. That, in turn, has kept employment high and company sales increasing.
As a result, U.S. GDP has remained surprisingly strong (in contrast to what we see in Europe).
Chart 3: U.S. GDP remains much stronger than Europe

Despite that, consensus has the economy slowing significantly into 2024. There are a number of reasons.
Services are weak and manufacturing is in a recession
Services and manufacturing indexes are now well off their post-Covid highs. In fact, the PMI for manufacturing shows the goods sector has been in recession for over a year now (the red line in the chart below is below 50). Other data shows weakness in forward orders as well as hiring intentions across manufacturers.
Even services growth has been falling and is now below pre-pandemic lows (green line).
However, with nearly 80% of the U.S. economy in the services sector – the net of the two indexes still shows growth (or “no recession”).
Chart 4: Services and manufacturing activity has normalized after Covid peaks

Employment is slowing
During the hectic recovery from Covid, which we see in the indexes above, there were two jobs for every person looking for work. Data show U.S. wages rose, especially in sectors re-hiring as spending patterns shifted, like leisure and hospitality, education and health.
That helped workers grow real wages — despite high inflation — which has helped with consumer spending. However, in the U.S., in particular, higher wages added costs to companies, reducing their profits.
In contrast, Europe saw more inflation later – due to its proximity to the war in Ukraine and its impact on local energy prices. During Covid, Europe also supported worker retention while businesses were closed, which reduced the amount of re-hiring needed when businesses reopened. Both factors delayed their wage inflation cycle, which is only now feeding through into inflation and company profits.
Chart 5: Wages are slowing quickly in the U.S., less in Europe, where inflation was more persistent

Overall, there are signs of the jobs market being back to more “normal” levels. We’ve seen hiring, quits, and labor force participation return to pre-pandemic levels. Layoffs, however, remain pretty low.
Though the U.S. unemployment rate remains historically low, it has started increasing. So far, the increase has mostly been due to higher wages bringing people back to the labor market (which is a good thing). But survey data suggests workers are getting less confident and finding it harder to get a job (red line below). Historically, that has been a sign that the unemployment rate will increase, too (blue line below).
Chart 6: When the unemployment rate increases, it often rises quickly and by a lot

This is a trend to watch, as we see that the unemployment rate rarely sees small upswings. Instead, it can turn into a sharp rise that reduces worker confidence. That, in turn, results in lower spending and companies needing to do layoffs, which can start a feedback loop resulting in a recession (grey zones above).
Consumer spending should slow
Strong consumer spending is a big reason the economy turned out to be so surprisingly strong in 2023. Consumer demand more than kept up with inflation, which also helped companies grow revenues (although not profits).
However, some suggest funds accumulated during the Covid pandemic are exhausted for lower-income households. That’s supported by the fact that credit card usage has increased, with balances hitting a new record of $1.1 trillion. Although, thanks to rising incomes, the debt-to-income ratio is far below record levels.
As the chart below shows, delinquency rates are also rising for credit cards (blue line) and auto loans (green line). Both are already above their pre-pandemic levels but far below credit crisis levels. That seems to indicate consumers might not be able to spend quite as freely in 2024.
Chart 7: Consumer stress rising as delinquency rates increase for credit cards and auto loans

Housing is still distorted (for better and worse)
Housing is one place where Covid distortions still affect the market.
First, we see mortgage delinquencies (purple line above) remain low. That’s despite mortgage rates roughly tripling to almost 8% recently.
Data shows the majority of homeowners have been relatively unaffected by rising rates because they locked in long-term fixed-rate mortgages, at an average of around 3.6%, back when mortgage rates were low.
That means the Fed’s plan to slow spending by raising rates hasn’t been as effective as they expected.
It also means consumers still have cash in their pockets, helping support spending.
However, it’s not been good for anyone trying to move. Giving up a 3.6% mortgage and adding a new mortgage costing more than 7% per year is expensive. That’s left most homeowners staying put, which has kept the existing home supply around historic lows (orange line in the chart below).
That, in turn, has been bad for anyone trying to buy a house. For them, not only are mortgages more expensive, but the lack of supply means prices have stayed high (green area in the chart below).
That’s left people who need a home forced to look more at new construction. As a result, residential construction and homebuilders have been strong. Unusual in a high interest rate environment.
Chart 8: New homes are surprisingly strong considering the costs of buying a home

Corporates also have gradual exposure to refinancing at high rates
The other thing higher interest rates were meant to affect was companies.
By raising interest rates, the Fed hoped to increase the costs of businesses, thereby reducing their spending.
Interestingly, although we have seen a rise in bankruptcies, the data suggests few are affected by interest costs. Instead, we saw a lull in bankruptcies caused by PPP loans and pandemic support – so this might be a “catchup” for businesses that might have otherwise failed earlier.
That doesn’t mean interest rates aren’t a concern for companies.
Interest rates are unlikely to return to near-zero levels. That leaves companies with more normal costs of capital going forward. As debt matures, it will need to be refinanced at these new – higher – rates. That, in turn, will increase interest expenses and reduce margins.
However, data suggests the maturity of company debt will be gradual. For example, Bloomberg data in the chart below suggests:
- Large-cap companies need to refinance less than 10% of their outstanding debt next year.
- Small caps only have to refinance about 5% of outstanding debt.
This gives companies time to wait for interest rates to fall before most debt needs to be refinanced.
Chart 9: Corporate refinancing schedule gives time for rates to fall

In fact, we are also seeing data that suggests companies that do need to refinance now are using very short-term debt – likely in the hope that they can refinance in a year or two at much better rates.
Companies have benefited from spending but hurt by rising costs
Looking at S&P 500 earnings, we have seen that companies have consistently grown revenues over the past two years, in line with strong consumer spending (black line below).
However, companies suffered from an earnings recession at the start of 2023. It seems that it was mostly caused by rising expenses, including rising wages, which reduced margins (blue line and blue box below).
Chart 10: Earnings expected to improve as disinflation and falling interest rates boost margins

Importantly, expectations are for U.S. earnings to grow almost 12% in 2024.
We see that trend starting in Q3, with earnings reaching a new high, exiting the year-on-year earnings recession. In addition, the Q3 earnings gains were broad-based – with eight out of 11 sectors seeing growth – and the consumer sectors especially strong.
Chart 11: Q3 Earnings growth was positive, with that expected to broaden in Q4 and 2024
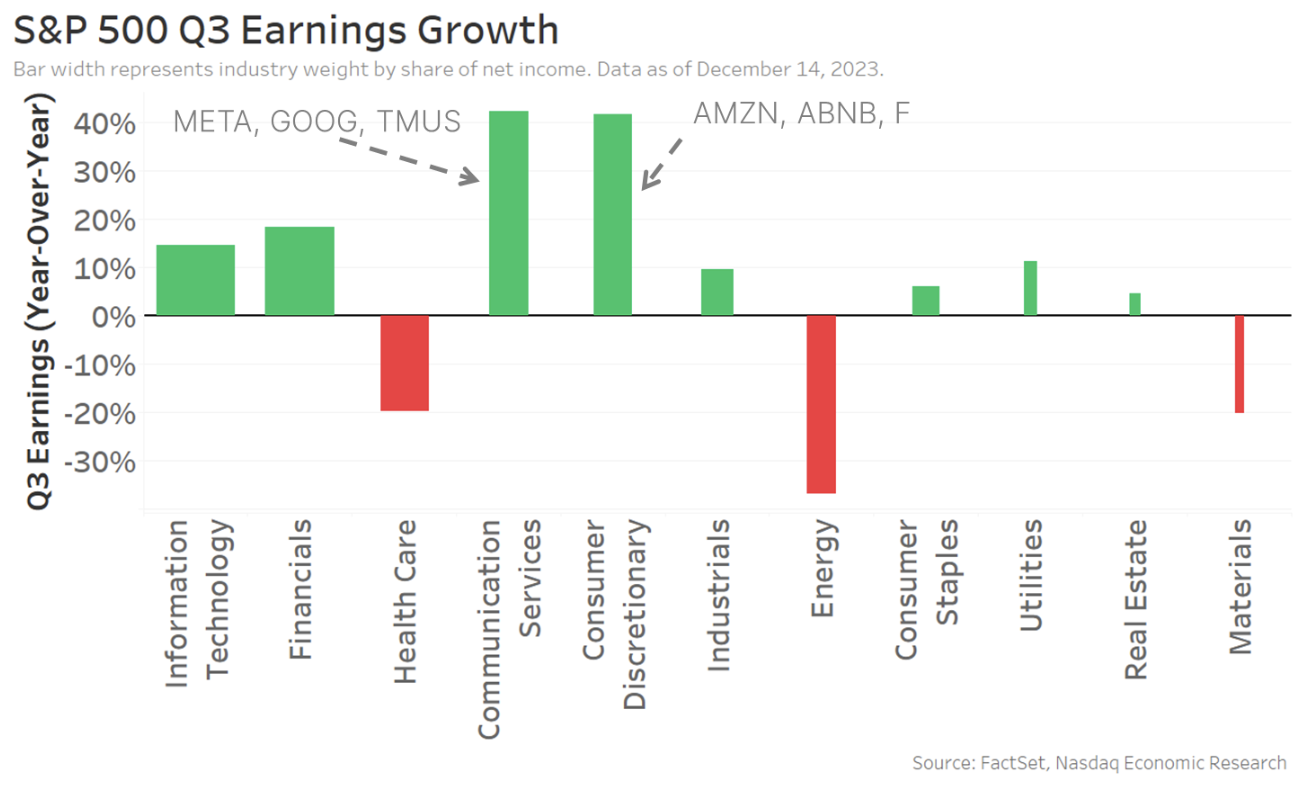
In 2024, healthcare, energy and materials are also expected to recover. Although with strains on the consumer we’ve already talked about building – consumer sector earnings should moderate.
Market valuations might already be pricing in earnings gains and rate falls
What does this mean for markets?
Unlike last year, where the Wall Street consensus was for the S&P 500 to fall 1.7% in 2023 (spoiler alert: it didn’t), the consensus is looking for the S&P 500 to gain 3.5% in 2024.
However, U.S. large-cap stock valuations are relatively high once we factor in earnings and current interest rates. So, it seems that stocks might already be pricing in the expected gains in earnings and falls in interest rates.
Given that, the market could plot the path suggested by Goldman Sachs below, where markets move mostly sideways in the first half of the year while we wait for confirmation of earnings growth and lower rates before a second-half rally as GDP globally starts to grow again.
Chart 12: Market expected to gain in 2024, but not until valuations normalize

2024: Likely a year of moderation
As we came into 2023, it was widely expected to be the year of recession. Instead, it turned out to be a year of economic resilience. Despite higher interest rates, the continued strength in labor and consumer spending drove company revenues and GDP growth.
The setup for 2024 is far less exciting (for now). Almost all the “stresses” from Covid seem to be gone.
That sets us up for a slower market next year. Some forecast GDP could grow less than 1% per annum. Combine that with inflation falling from 3.1% (now) to closer to the Fed’s 2% target, and there is reason to think rates could fall significantly.
Based on our previous work on demographics and the aging U.S. workforce, rates around 1% higher than inflation could be just about right to deliver a soft landing. On that basis, an end-of-year 2024 rate as low as 3.5% is plausible, representing cuts of up to 2% next year.
That all helps the Fed deliver its planned soft landing – it might even help the property market normalize.
Ironically, if things slow down even more, leading to an uptick in unemployment or a slowdown in consumer spending, rates could go down even faster.
Michael Normyle, U.S. Economist at Nasdaq, contributed to this article.
Creating tomorrow’s markets today. Find out more about Nasdaq’s offerings to drive your business forward here.


