When we think about disruption, we generally tend to think about technology and the impact it has had on our industry, and its influence on our daily lives. But the reality is that is just the tip of the iceberg.
When we dig below the surface, and if you have read any news headlines recently (setting aside the fact that an algorithm may have fed you those), you may have noticed that disruption doesn’t stop there. We are witnessing a sea change in political, social, and environmental views. Even the dinner plate is not immune: What food should we eat, is the plant-based diet or the meat-based diet better? (I will save this topic for another time..)
This ‘Philosophical’ disruption has important ramifications for all of us, and it is a lead indicator that should inform us that everything we know is due for a re-think. Let’s try a little thought experiment: What would you say if I told you that the Earth was flat?
I know, it may sound crazy, but before you dismiss the idea entirely, let me take you on a quick flat earth tour:
What are the inherent philosophical differences between a Round Earther vs a Flat Earther?
The world of modern psychology describes Flat Earthers as being subject to the Dunning Kruger effect, which states that non-experts overestimate their understanding based on simplistic facts, that lead them to extrapolate ideas that have little scientific basis. In the opposite corner, the Flat Earth camp allege that Round Earthers are subject to confirmation bias, where they pay more attention to people and ideas that they agree with or that they have been taught. The key argument is that that they do this without independent first-hand experience.
I am guessing that this far in, most people have already dismissed the Flat Earthers, but wait, not so fast! There are some essential truths hiding behind that gigantic ice wall:
What do we know through our own experience? Have any of you ever been on the International Space Station to actually observe the curvature of the earth? Has anyone ever conducted any experiments to test the hypothesis?
Do we ‘know’ that the earth is round, or do we simply ‘believe’ that the earth is round, because we were taught that?
Who are we programmed to trust? Do the ideas of Neil DeGrasse Tyson, the archetypal scientist, hold more weight than self-proclaimed flat earth activist Mark Sargent? If so, what drives that?
So is the earth flat or round? (Drum roll). Okay, breathe, it is (probably) round, but what emerges from this debate is: Whether we like it or not, a lot of what we know is not from our direct experience, rather we learn it from someone else, and that is continually reinforced throughout our lives. Our biases can also play a big part in deciding whom we trust, and therefore what information we are willing to absorb or discard.
What on this Flat Earth has any of this got to do with trading?
Could it be time for us to embrace some of these ideas, and challenge the current order of things? Can we step outside (mind the dome) and re-examine the way we think about our own little world of trading and execution?
It IS what it IS or IS it?
As in life, in trading, everything is fair game for a rethink — including the most tightly held notions of what provides for the best implementation shortfall returns. Robert Almgren, one of the pioneers in the research into optimal execution strategies (Almgren-Chriss), had his own flat-earth moment, when he was quoted in an article “Why Robert Almgren no longer trades using Almgren Chriss” (Risk.net Magazine July 2017) – because he now believes that the model he co-authored, requires a radical rethink that challenges some of the fundamental assertions that formed the basis of his initial theory. If Almgren can take a view that challenges the current order (that he created!), it means that we as an industry should be open to questioning our own historical approaches, either to verify or challenge the way things have been done.
Spinning wheels
In my previous article ‘Letting go of the wheel’, I touched upon some of the more macro philosophical issues that we have seen play out after the introduction of The Wheel. If the goal is to continually improve execution quality and ultimately investor returns:
How might the buy-side and sell-side work together to integrate the PM investment process to inform our algo trading decisions, to capitalize on the valuable information that precipitates trading activity?
How can the sell-side use new research and technologies to optimize trade planning and execution: Can we look at IS in a new light, by taking a leaf out of the new research from Almgren and others?
How might the buy-side balance the dilemma of encouraging competition for best execution on the Wheel, while still ensuring that the results do not end up self-fulfilling and tying them to their methodology(s), given that our ideas of what is ‘best’ will also likely change?
In light of the current wave of disruption we are experiencing, this is the perfect time for us to challenge and rethink our assumptions. Not just in pursuit of change alone, but to be honest and ready to re-pivot our ideas as we craft new ways to move forward as an industry. Can all the buy-side and sell-side Flat Earthers please step forward!
Author Raj Mathur is Co-Head of AES (Electronic Trading) APAC
The FIA announced the election of new directors to its board at the annual board of directors meeting. The board added Paul Anderson of Deutsche Bank, Samina Anwar of Cargill, Kari Larsen of Perkins Coie, John Murphy of Mizuho Securities USA, and Jamila Piracci of Roos Innovations.
The meeting took place via teleconference due to concerns over the Coronavirus (COVID-19).
The Board also confirmed the following officers:
Chairman – Jerome Kemp, Citigroup Global Markets
Vice Chairman – Nicholas Rustad, J.P. Morgan Securities
Treasurer – Eric Aldous, RBC Capital Markets
Secretary – Najib Lamhaouar, HSBC Bank plc
The following directors were elected to a two-year term:
Primary Member Directors:
Paul Anderson, Deutsche Bank AG
Alicia Crighton, Goldman, Sachs & Co. LLC
John Dabbs, Credit Suisse Securities (USA) LLC
Jan Bart de Boer, ABN AMRO Clearing Bank N.V.
Thomas R. Kadlec, ADM Investor Services, Inc.
James Masserio, Societe Generale Corporate and Investment Banking
George Simonetti, Wells Fargo Securities, LLC
Jason Swankoski, Morgan Stanley
Associate Member Directors:
Clive Christison, BP Products North America Inc.
Kari Larsen, Perkins Coie LLP
Kenneth M. Raisler, Sullivan & Cromwell LLP
At-Large Member Directors:
Michael C. Dawley, Bluefin Partners LLC
John Murphy, Mizuho Securities USA LLC
Jamila Piracci, Roos Innovations
In addition, Arthur Hahn has been appointed to be a Special Advisor to the board.
The COVID-19 market correction has been on a scale not seen since the Great Recession. Using charts available on the Eikon coronavirus app, March’s Market Voice examines previous epidemics and the influence of current monetary conditions.
The 11.5 percent one-week drop for the S&P 500 during the last week of February has only been exceeded on three occasions since 1960.
COVID-19 seems to have more in common with the 1968 Hong Kong flu epidemic than the 2003 SARS outbreak.
Most bear markets have taken place at times of tight monetary policy, whereas the current market correction is during a period of low interest rates.
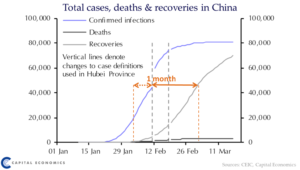
The U.S. stock market seemed unconcerned about coronavirus (COVID-19) until the last week of February. As shown in Figure 1, the market rallied through the early January identification of the virus and the first reported death in China.
By mid-January, the rising death toll and Wuhan quarantine created concerns about a slowdown in global growth that was reflected in the sharp drop in copper prices to a near three-year low.
The S&P 500 (SPX) initially sold off in sympathy with copper, but the rally resumed in early February despite the World Health Organization (WHO) declaring COVID-19 a global emergency. The market made new highs even as the death toll exceeded that attributed to the SARS epidemic.
Figure 1: Coronavirus (COVID-19) timeline and market (lack of?) response
Source: Eikon
As February closed, the infection finally impacted the U.S. stock market, causing the biggest weekly SPX decline since the Great Recession. The stock market has since suffered further declines and volatility as the cases of COVID-19 continue to rise.
While the slump reflected concerns about the COVID-19 threat to global growth, it is hard to pin the sell-off to any specific virus-related event or announcement.
Instead, as is shown in Figure 2, the trigger for the COVID-19 market correction may have come from a subtle U.S. Federal Reserve tightening of monetary conditions.
Impact of Federal Reserve policy
The Fed overtly shifted to a more accommodative policy in the third quarter last year when the Fed funds rate was cut for the first time since 2008. The Fed further abetted monetary accommodation at the start of the fourth quarter by expanding its balance sheet.
The stock market responded positively to the Fed easing and the growth in the balance sheet sustained the market uptrend even after Fed funds bottomed in November.
The Fed halted balance sheet expansion at the end of the year and while the market made a new high in February it was on declining momentum. More importantly, both the January and February market peaks were linked to balance sheet contractions.
While the Fed was probably not directly responsible for the market decline, the (perhaps unintended) contraction in liquidity may have made the market more vulnerable to virus-related bad news.
Figure 2: Monetary conditions and the stock market rally (weekly closes)
Source: Eikon
The seeming good news is that if the decline was triggered by a modest move to tighten monetary conditions then the recent dramatic Fed shift back to easing should allow a resumption of the bull market trend.
While the market bounced in early March in anticipation of the Fed — and other central banks — easing, the benefit was short-lived. As noted above, the market has gone back into steep decline despite the efforts of the Fed to supply support and the Trump administration’s promises of fiscal action.
We posit that monetary tightness made the market vulnerable to bad news but was not itself the bad news. A resumed bull market would imply COVID-19 is not a significant factor for market performance; the continued doldrums for copper prices argues otherwise.
Watch: Coronavirus Correction Series — Episode 1 — An Introduction
Is COVID-19 playing out like SARS or the flu?
While COVID-19 and SARS (Severe Acute Respiratory Syndrome) are both coronaviruses and distinctly different from the flu virus, there are significant deviations in fatality and contagion rates.
SARS was quite lethal; in its active period from 1 March to 31 July, 2003 WHO estimates there were a total of 8,437 cases of which 813 died for a very high mortality rate of almost 10 percent (by comparison, the common flu has a mortality rate of about 0.1 percent).
SARS had a high death rate but it was not easily transmitted so was relatively easy to contain. WHO identified SARS as a global threat in mid-March 2003 but only four months later in July the SARS threat was declared over.
COVID-19 is highly contagious and spreading faster than SARS. Figure 3 from the Eikon Coronavirus App demonstrates that the identified cases and deaths from COVID-19 already exceed the entire impact of SARS, even though it is still in the early stages.
The mortality rate of COVID-19, while lower than SARS, is still not well determined. WHO-sourced data suggest a COVID-19 mortality rate of around three percent — still dramatically worse than the flu.
But because COVID-19 can occur asymptomatically, the number of actual cases is probably substantially higher than reported, so the actual mortality rate is probably lower.
According to the Chinese Center for Disease Control and Prevention, while the nationwide mortality rate is 2.9 percent the rate outside of Hubei (including Wuhan) is only 0.4 percent.
And in contrast to SARS, which was lethal for a broad spectrum of the population, COVID-19 deaths are largely patients above 65 with pre-existing health problems.
Figure 3A: A comparison of SARS and COVID-19 contagion
Source: Eikon
Figure 3B: A comparison of SARS and COVID-19 mortality rate
Source: Eikon
Even though it was not a coronavirus, the profile of the Hong Kong flu epidemic would seem to more closely match the experience to date for COVID-19.
In hindsight, the disease started spreading in Hong Kong and China in the first half of 1968, but it was not identified by WHO until mid-July. By late July it had spread to South-East Asia and well before the end of the year had evolved into a global epidemic — including the United States.
So like COVID-19 it was highly contagious and with a mortality rate close to the ex-Hubei China rate of 0.4 percent. Hong Kong deaths were also concentrated in elderly patients with health issues.
But because it was hard to contain, the case load was very high and roughly 18 months elapsed before the contagion faded — the overall death toll was more than one million people.
Figure 4 shows how the SPX performed in the context of these three epidemics. As with the death toll, the COVID-19 market correction has already exceeded any impact from SARS.
The stock market also initially made a new high in the early stages of the Hong Kong flu epidemic but then went into an extended decline, ultimately dropping roughly 17 percent from the peak. It then found support in the later stages of the virus.
Clearly, there were other drivers of the market than just the flu epidemic in 1968-69, nevertheless, this still should raise concerns about the poor potential for a resumption of the bull market while COVID-19 is still spreading.
Figure 4: Comparative SPX performance during COVID-19, SARS and HK flu epidemics
Source: Eikon
The COVID-19 market correction
The 11.5 percent decline in the last week of February was not just the worst since the Great Recession but there have only been three weeks since 1960 that saw a decline greater than this, and they make for rather frightening company: 10/10/08, 09/21/01 and 10/23/87.
These declines came during some of the worst market events of the past 50 years. In every case the market dropped another 20-25 percent after the extreme weekly decline before hitting bottom.
Before recommending to “sell everything” it is important to note some key differences between the recent weekly decline and its ugly brethren.
First in the three prior episodes the outsized weekly decline occurred well after the bear market was established, not at the start of the downtrend. More importantly, it is very rare for a sustained market correction to emerge when the Fed funds rate is not significantly positive in real terms.
The table below identifies all post-1960 “sustained corrections” which we define as the SPX being down at least 10 percent (on a month-close basis) year-over-year for two consecutive months.
This includes all events of traditional bear markets (down at least 20 percent from peak to trough) but also picks up some more modest but still extended declines (1965, 1976, and 1990).
In the Figure 5 table, the date of the “Market peak” is the highest month-end close prior to the identified decline, the “Total decline” is the drop to the ultimate trough, and “months” is the period from peak to trough.
Figure 5: Extended Market Corrections
Market peak date
Total decline
Length in months
Real Fed Funds at peak
Oct-61
-23%
18
1.20%
Sep-65
-18%
4
2.63%
Nov-87
-33%
19
0.90%
Dec-72
-46%
21
2.50%
Dec-76
-19%
14
-1.93%
Nov-80
-24%
20
6.46%
Aug-87
-30%
3
2.75%
May-90
-16%
5
3.43%
Aug-00
-46%
25
4.05%
Nov-07
-53%
16
2.40%
Feb-20
-19%
1
-0.72%
Source: Eikon
“Real Fed Funds” is the nominal Fed funds rate less trailing annual CPI (excluding food and oil) inflation. It is apparent in Figure 5 that onsets of all bear markets and — except December 1976 — extended market corrections, emerged in an environment of tight monetary policy.
Fed funds were generally at least a percentage point above the rate of inflation and, since 1980 it has been at least two percentage points above inflation when an extended downmarket commenced.
Based on this history, it seems unlikely that we are at the beginning of an extended market decline. But there is the one exception of 1976 where the shock of the second oil crisis sent the stock market into its only prior sustained decline in the absence of a positive real Fed funds rate.
Like COVID-19, the second oil crisis created substantial dislocation in global supply chains and output, causing sharp slowing in GDP growth both globally and in the U.S. from 1974 into 1976.
Although the US economy started to rebound in 1978, the stock market continued to sink into early 1978 in conjunction with the rise in oil prices. The overall story of the market decline is more complex but still suggests that it will be difficult for the market to recover until the negative impact of COVID-19 on the global economy fades.
The fact that OECD has downgraded its 2020 global growth forecast by 50 basis points does not bode well for the market. But it is worth noting that the overall decline in the market was modest enough that it does not qualify for the traditional definition of a bear market.
Figure 6: Oil Prices and the SPX during the second OPEC crisis
Source: U.S. Energy Information Administration and Eikon
The bottom line: A modest potential downside?
The high degree of uncertainty over the outlook for COVID-19 makes it hard to have conviction on a bottom line.
To date, the COVID-19 market correction seems to have more in common with the 1968 Hong Kong flu epidemic than the 2003 experience with SARS. If so, it suggests that even with the Fed easing, the market is likely to struggle while COVID-19 continues to spread and the number of cases are increasing.
The end-February weekly decline was unusually large and historically only seen in the context of substantial market declines — greater than 30 percent — but the fact that it is emerging in an environment of low real interest rates points to a much more modest downside.
Both the market reaction to the Hong Kong flu and the shock of the second oil crisis in the mid-1970s suggests that the total downside from the February peak should be in a range of 15-20 percent, which would indicate that we are pretty near to the bottom.
The market is likely to remain volatile near-term and a resumption of the bull market will probably have to wait until the virus is clearly under control, which may not be until sometime in 2021.
How to track the market developments:
The Corona Virus app in Eikon is your single destination to keep track on the key market moving headlines as well as the charts, data and impact analysis on the markets, sectors and commodities asset classes. If you’re an Eikon user, simply search for ‘Corona Virus’. If you’re not a user, get access now or switch to Eikon.
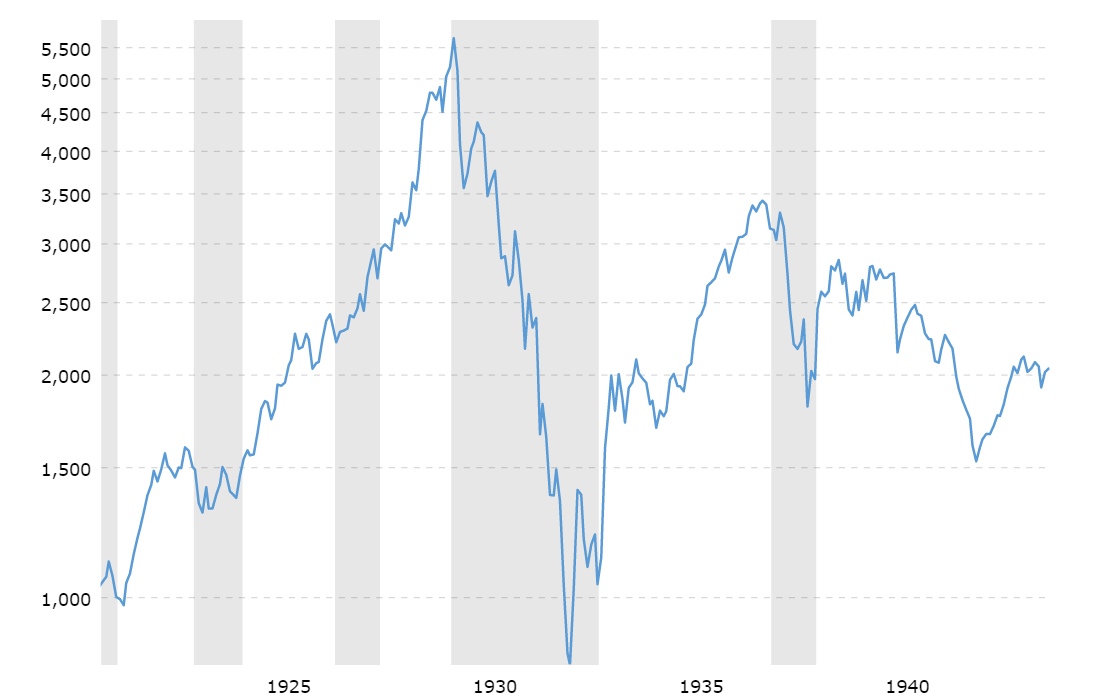
We all know about the Great Depression, right? It was started by the Stock Market Crash of October 1929…except that the crash didn’t actually happen in October of 1929.
At least, it didn’t if you were trying to time when the market “bounced” and began to recover.
As we can see from the above chart, the historically accepted date of October 1929 as the start of the crash is a little bit misleading. While it’s true that between the DJIA’s record-breaking (at the time) high of August 1929 (5,671.48) and the beginning of November 1929 (3,563.22) the Dow did shed nearly 50% of its value, the true bottom of the market wasn’t until almost three years later, when the market grounded out at a bleak and catastrophic 812.59 in June of 1932.
Nor is this the only example of economists, financiers, and the common citizen grossly underestimating the timing of a market correction, or “bounce.” during a recession.
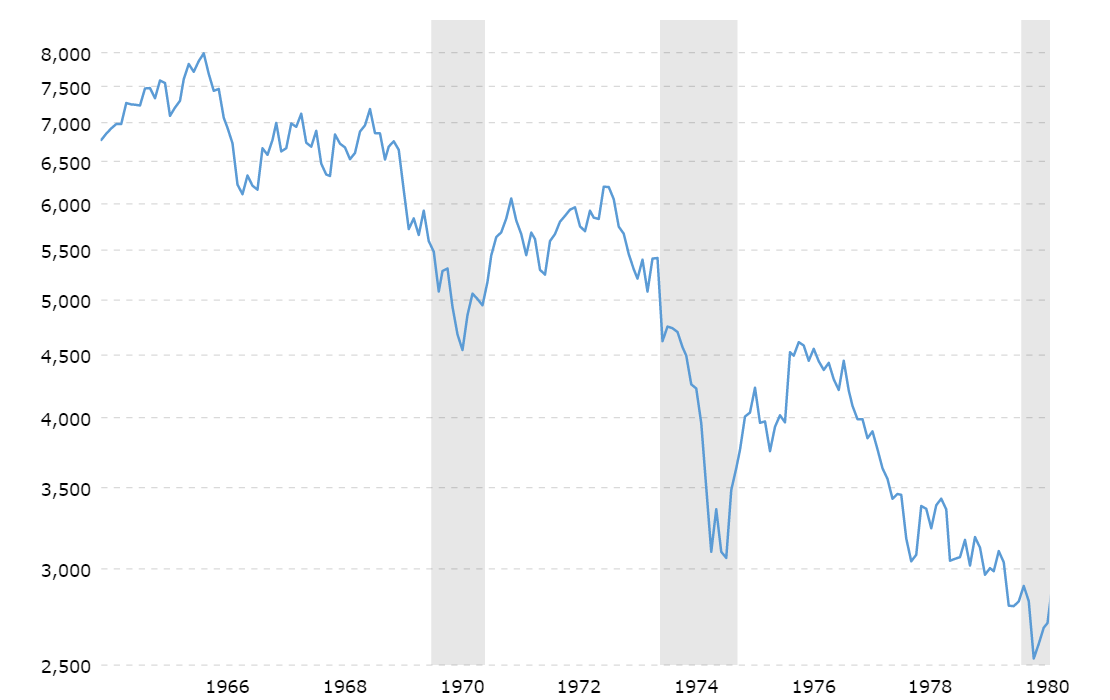
Remember the Gas Wars of 1970? Can you picture the photos and videos of miles-long stretches of MASSIVE automobiles lined up on freeways, side streets, and through neighborhoods of America, waiting for their turn at the gas pump? That uncertainty in the oil market, along with the geopolitical tensions in the Middle East (at the time the only major US oil exporter), caused another crash. Here’s what that chart looks like:
Again, if you’d bought into the market after either of those first MAJOR dips in 1970 and 1973–4, you’d have lost a ton of money before the market bounced and started to climb again.
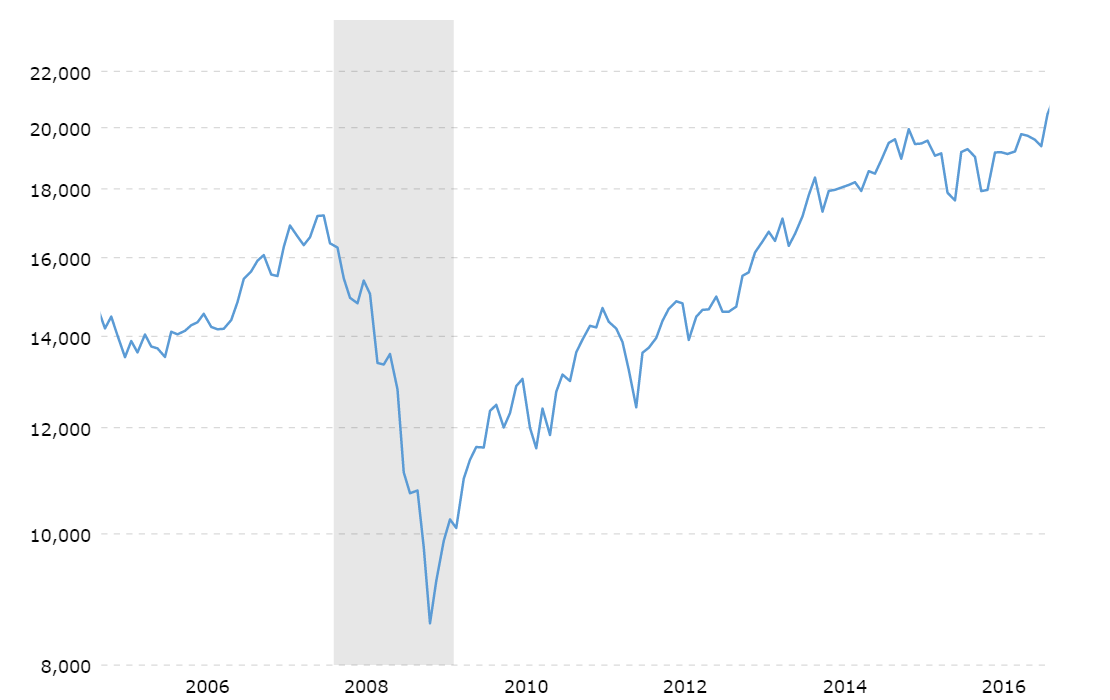
The same even goes for 2008. The subprime mortgage crisis, and corresponding nosedive in the stock market, began in mid-2008, but the market didn’t actually hit rock bottom and begin to recover until February 2009, as you can see in the below graphic:
Each of the examples above should serve as a reminder to us of how dangerous it can be to try to time the market, not only in trying to time when stocks will rise but even more so when they will fall. Many, many investors lost a lot of money in each of the major recessions of the 20th and early 21st centuries, by thinking they had timed the “bounce” correctly and that the market was on its way back up.
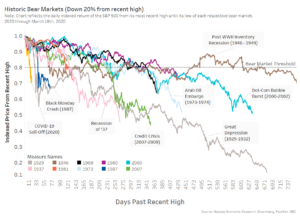
As we can see in the above charts, stock market declines don’t look like ski slopes, one long unbroken slide to the bottom. As governments, financial players, and individual investors en masse, make decisions to try to stem the descent, the market can pause, and even climb a bit before resuming its fall, meaning that, pardon my dark humor, most stock plunges actually look more like this:
The safest thing you can do is nothing. Just maintain your investing strategy, and continue to make contributions to your investment accounts at regular intervals. Over time, this will average out to be a much more effective strategy that minimizes your risk than trying to time any bounces or dips in the market.
If you’re a bit more willing to expose yourself to risk, however, in the hope of making more significant gains, then having a portfolio strategy that is not only “recession-proof” but actually recession-optimized is a better bet. Optimizing for a recession, i.e., taking advantage of the market downturn to either earn a profit on hedging, or to set yourself up to reap the maximum benefit when the market DOES inevitably begin to recover (which, by the way, it ALWAYS does) is a somewhat riskier, but infinitely more rewarding strategy. If you are young, and earning a regular income, and won’t need to tap into retirement income for a while, this idea of recession-optimization may be one that you want to consider. There are many great resources out there to help guide you along the way, or you can stay tuned here, as I will be writing more on the topic of recession-optimized investing tips from my viewpoint as a non-professional stock enthusiast later this week.
In conclusion, whether you decide to opt for the “best thing to do is nothing” or the recession-optimization strategies that are out there, either of those options will ultimately bear far more fruit than trying to time the dip, and risk losing significantly MORE money because the market hasn’t fully bottomed out yet. As the graphics show above, the stock market is subject to emotion, fear, and human input, not pure mathematical or financial data. Factoring in the complexity of human input into the stock market is why it’s ultimately a fool’s game to try to time ANYTHING related to the stock market.
Although the market action recently seems crazy, and the selloff has been dramatic, markets are doing what markets do best. Providing liquidity and estimating future valuations.
Fastest bear market in history (but not the worst)
It is true this is the fastest bear market in history. As recently as Feb. 19, 2020, the S&P 500 was at all-time highs. Now the market is down nearly 30% from those levels.
That’s despite the economic data coming in this week, for retail sales and industrial production the U.S., is still showing how strong the economy was in February.
That shows that this market is not being driven by historic data, it is being driven by expected future data.
Chart 1: This bear market has been fast, but not unprecedented in its impact on prices
There is reason for optimism
Looking at the data, it wasn’t until late January that China started to see the growth of Coronavirus. Within three weeks their number of cases had swelled to around 60,000.
The good news is that once social distancing was put in place, the number of new cases slowed. In fact, in early March, just six weeks from the start, new Chinese cases were down to a trickle and an end was in sight.
Despite that, there remains a risk that a second wave of cases occurs if society returns to normal too quickly. In fact, a recent uptick in new cases in China were mostly from people returning from other countries.
Similarly, Korea saw its first cases mid-February. Right now, data show they too seem to have reduced the expansion of the disease, after just four weeks.
That’s important, because it seems to indicate that with strong quarantine procedures it is possible to control Coronavirus within four weeks and mostly stop the spread within six weeks.
Chart 2: The duration of a downturn is likely to be two months at best, even in China it took a week from infection to detection to recovery
Why is that so bad for markets?
Which makes you wonder, how bad is this for markets?
One of the problems with quarantine is that many industries don’t experience a slowdown, like they would in a normal recession. Instead they experience a hard stop. Consider the bans this week on restaurants and travel between the U.S. and Europe. Not only will those businesses have no revenue to offset their costs, some will be forced to furlough workers to maintain operations. Those workers in turn will stop spending, which can start the feedback loop of a recession, where lower spending leads to lower profits and even more job losses.
An interesting article by a UC Berkeley Professor talks about how this “hard stop” is different to a classic recession. He forecasts GDP could slow by 5%. That is consistent with the slowdown seen in the Spanish Flu in 1918, another high-mortality contagious virus which lasted for over a year. With US GDP running at around $76 trillion, a yearlong slowdown of that magnitude could cost around $4 trillion.
In a similar prolonged slowdown, this hard-stop could be similar to the 2008 Credit Crisis, where companies and potentially whole industries need bailouts to survive.
Importantly though, in 2008 many banks suffered from bad management decisions which created a moral hazard for the government to lend support. As we know from 2008, bailouts that happened typically resulted in the loss of all or most of the equity in a company.
This time the government is shuttering businesses for the public good, so the moral hazard does not exist. In fact, there is also an economic case for the government to use public money to replace the lost demand, at least “make companies whole” on unavoidable operating costs, allowing them to keep staff under-employed and business ready to restart when travel restrictions are lifted.
That is where some of the rescue packages are now heading, with a $1.3 trillion stimulus plan in the U.S. and a $1 trillion rescue announced in Europe, in addition to country specific plans.
What’s the likely economic impact?
To understand the economic impact of quarantining a whole population let’s look again at China’s data.
Although the numbers are striking, data also shows China managed to commence recovery in around two months, so the impact on whole year GDP should be a fraction (although maybe one-sixth) of the second scenario above.
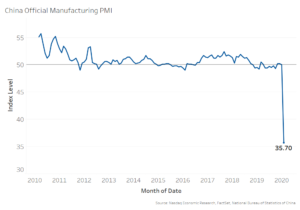
While China’s workers were quarantined, productivity and output literally fell off the charts. Industrial production fell around 20%, retail sales and fixed asset investments fell almost 30%. The official manufacturing PMI dropped from 50 to 35.7.
Chart 3: Social distancing slowed the Chinese economy dramatically
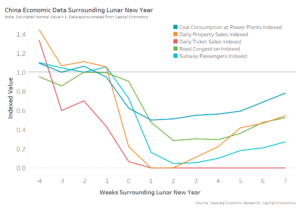
Today, around two months after this all started, people are starting to return to work. But data show the recovery might be slower than expected as people still avoid activities that risk of social contact and infection.
For example, data show coal consumption for power generation remains 30% below normal levels, road congestion is still 40% below normal levels. Other more “risky” activities that require physical proximity, like riding the subway remains down even more, around 66% below normal while attendance at movies has virtually stopped. Other data shows that passenger arrivals in Hong Kong and Thailand airports are around 10% of normal levels, and that in turn affects oil demand, restaurants, hotels and tourism even in unaffected locations.
Supply chains are also disrupted. Chinese ports have triple the normal number of containers waiting to be offloaded.
Chart 4: Two months after the onset of cases, the Chinese economy is still not back to full strength
Even in China, the slowdown was sharp, and the recovery may not be “V-shaped.” Markets can use that as a data-point to revalue global assets.
Market swings are data driven
Right now we are in the growth phase of Coronavirus infection in western countries. The two very different outcomes above both appear possible, which creates uncertainty.
If the world can contain the virus quickly, as China and Korea did, the impact on workers and companies should be manageable, and the markets may well have overreacted.
If we fail, some models estimate we could experience losses of life and GDP closer to the magnitude seen 100 years ago in the Spanish Flu.
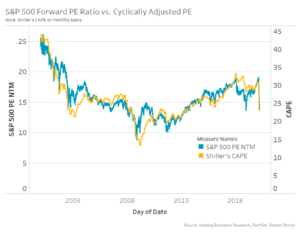
Forward PE’s look attractive for a period with such low interest rates, but they aren’t even close to the levels seen during the 2008 Credit Crisis or even the Sovereign Debt Crisis, where negative earnings and corporate solvency was a problem.
Chart 5: Forward PE’s look attractive for such low interest rates, but aren’t at 2008 Credit Crisis or Sovereign Debt Crisis levels where negative earnings and solvency was a problem
There is a big difference between these two outcomes. That’s why the market is moving so much.
Each piece of good news, from a slowing of new cases, to a vaccine, to government support make it more likely that companies will survive and business will get back to normal. That helps markets rally.
But bad news about increased spread of the disease, medical shortages and furloughs make it likely stock earnings will be lower for longer. That makes prices fall.
We need data on whether containment measures are helping. Given the incubation and contagion periods for this virus (Chart 2), we might take two or more weeks to see.
In the meantime, know that markets are already expecting a less than perfect result. So each piece of news (good and bad) should affect valuations accordingly. That’s one thing markets do well.
The following statement was issued by SEC Chairman Jay Clayton:
The consolidated audit trail (“CAT”) is intended to enhance regulatory oversight of our securities markets. Our equities and options markets operate through multiple exchanges and other venues and the CAT will facilitate cross-market oversight and analysis, thereby improving investor protection and market integrity. The CAT NMS Plan governing the CAT was approved in November 2016 and required the development of the CAT by FINRA and the national securities exchanges (collectively, the “SROs”). According to the CAT NMS Plan, broker-dealers were to start reporting to the CAT by November 2018. While the SROs were unable to establish an operational CAT by November 2018, the SROs have made progress with respect to testing in advance of broker-dealer reporting including opening the test environment for broker-dealer reporting in December 2019 and continued roll-out of functionality into that environment earlier this year.
Clayton, Jay Sullivan & Cromwell
Temporary COVID-19 Staff No Action Letter
At this time, a wide range of broker-dealers are actively testing and refining their ability to report to CAT. COVID-19’s impact on market participants, including necessitating SROs and broker-dealers to implement their business continuity plans, has placed stress on their information technology infrastructure and required the deployment of significant resources, including to implement and adapt business continuity plans. To allow firms to maintain focus on operational readiness and reduce operational risk, SEC staff has issued a no-action letter regarding the SROs’ enforcement of their CAT compliance rules through May 20, 2020 so that personnel who are working on CAT matters but are important to maintaining critical operations and implementing business continuity plans can focus their attention on those immediate needs.
Reducing Cybersecurity Risks
While the SEC staff has provided a temporary no-action letter with respect to certain CAT compliance rules in response to COVID-19’s impact on market participants, the SEC remains committed to establishing a fully operational CAT. It is important that CAT implementation becomes a reality. A critical step towards doing so is ensuring the protection of sensitive information submitted to the CAT, particularly retail investors’ personally identifiable information. This issue has been, and will remain, of paramount importance.
I believe the CAT’s regulatory objectives can be achieved without collection of the most sensitive pieces of retail investor information. It is important to minimize the impact of any potential data breaches, while also evaluating the need for cybersecurity improvements to the CAT.
To that end, today the Commission issued relief that exempts the SROs from collecting or retaining certain retail customer data, including (1) individual social security numbers or individual tax payer identification numbers (collectively, “SSNs”); (2) dates of birth and (3) account numbers. Instead of including these most sensitive pieces of personally identifiable information in the CAT, broker-dealers would be required to report an account holder’s name, address, and birth year. Given the limitation of personally identifiable information to “phone book”-type information, I believe this represents an important step in significantly reducing the risk of retail investor identity theft associated with the CAT.[1] This is a significant step towards standing up the CAT.
Additionally, I understand and share the concern regarding the risk and impact of potential data breaches.
While the CAT NMS Plan currently has extensive security requirements,[2] I believe we can and should consider taking additional steps to ensure the security and confidentiality of CAT data, including in response to developments in data systems and cybersecurity since the 2016 adoption of the CAT NMS Plan. I have asked the staff to prepare a recommendation for the Commission on improving the data security requirements in the CAT NMS Plan this year.[3] In developing the recommendation, I have asked that staff consider the following questions:
Are there alternatives to “bulk downloading” data by each SRO that would better secure CAT data?
What are the risks of proliferation of CAT data across multiple environments?
Are there additional data security issues regarding the use of CAT data for regulatory purposes that should be addressed?
How will access to customer and account information be addressed to restrict access to the greatest extent possible while still preserving the ability to achieve regulatory purposes?
Is oversight of Plan Processor security decisions effective and comprehensive?
To what extent can there be additional transparency regarding the security of CAT and the use of CAT data without making the CAT system vulnerable to bad actors?
Are there additional security measures that would enhance the security of CAT data, both within and outside of the CAT system?
Conclusion
We will continue to closely monitor the impact of COVID-19 on our markets more generally as well as on the roll-out of CAT. In addition, with the issuance of the cybersecurity-enhancing exemptive relief, we take another significant step towards a more secure CAT. As we look towards further efforts in this area, I believe we should continue to have data security as our priority while preserving the intended regulatory value of CAT.
TransFICC, the specialist provider of low-latency connectivity and workflow services for Fixed Income and Derivatives Markets, and SoftSolutions, the developer of high-performance mission-critical platforms, have announced a partnership to provide clients with connectivity and workflow solutions for Interest Rate Swaps.
Using TransFICC’s ‘One API for eTrading’ platform, SoftSolutions will be able to offer its clients access to IRS e-trading, in addition to its existing Rates and Credits services. TransFICC and SoftSolutions will support specific workflow functionality demanded by firms trading in the Swaps market, including Request for Quote (RFQ), Request for Stream (RFS), Request for Market (RFM), Process trades and Lists/Compression trading. Product scope includes vanilla and custom outrights or multi-leg packages (for example, switches, butterflies, and basis).
“Technology that supports multiple trading protocols and workflows with maximum consistency is in high demand among our clients and prospects, and our new partnership allows us to roll out this functionality to European clients,” said Steve Toland, Founder of TransFICC. “Working with SoftSolutions allows us to extend our product coverage to include IRS and to quickly connect with SoftSolutions’ existing clients.”
“By working in partnership with TransFICC we are able to offer our clients access to trade in a new asset class in only a short period, as the IRS workflows and connectivity services are already in Beta,” said Roberto Cocchi at SoftSolutions. “TransFICC’s integration with nexRates provides our clients with seamless access to multiple markets, with all connectivity provided as SaaS. Partnerships between FinTech specialists can, and should be the norm in this industry, where all stakeholders benefit from a best-of-breed solution without the enormous burden often carried by less agile players.”
TransFICC enables financial institutions to access their required eTrading venues, whilst streamlining technology requirements and reducing operational costs. Its unified low-latency, robust and scalable ‘One API for eTrading’ platform enables banks and the buy-side to connect with multiple trading venues while supporting a variety of workflows across multiple asset classes such as Rates and Credit Bonds, and Interest Rate Swaps. The service supports risk controls, workflow normalisation, market data, messaging, hardware and hosting, connectivity and multiple trading protocols, including CLOB market data, market making and order entry, RFQ and List trading (non-contingent, all-or-nothing, and trade at close).
SoftSolutions! provides multi-market, multi-asset, high performance connectivity and price distribution Market Making platforms. Its solutions include nexRates, XTAuctions and BestX!. The Rates EMS platform, nexRates, provides a full range of services to support sell-side clients trading Rates products. XTAuctions enables Primary Dealers to perform EGB primary auctions, and BestX!, a buy-side EMS, allows trading desks to auto-ex on all Fixed Income venues, with unrivalled richness of algos and trading parameters.
TransFICC’s clients include five global investment banks and one global market data vendor. SoftSolutions!’ clients include major global investment banks, regional sell-side champions and one global private bank.
Hedge fund losses picked up in February with the industry down 2.81% for the month, according to the Barclay Hedge Fund Index compiled by BarclayHedge, a division of Backstop Solutions. By comparison, the S&P Total Return Index was down 8.2% for the month.
For the year-to-date the hedge fund industry was down 3.00% through the end of February. The S&P Total Return Index was down almost 8.3% over the same period.
All but a handful of hedge fund sectors were in negative territory for February, as what little good economic news to be found in the month was offset by the impact of the spreading coronavirus.
“In ordinary times, news like favorable U.S. manufacturing data and a strong U.S. January jobs report might have provided a boost. But, with the coronavirus, these aren’t normal times,” said Sol Waksman, president of BarclayHedge. “As the month continued—and with it, the spread of the virus—we saw markets in turmoil including the worst week for stocks since the 2008 financial crisis as businesses and investors tried to gauge the potential economic impact of the novel coronavirus.”
Among hedge fund sectors, only four of BarclayHedge’s 31 indices were in the black in for February. In a month marked by extreme volatility, the Volatility Trading Index set the pace among gainers, up 1.38% for the month. Others posting February gains included the Convertible Arbitrage Index, up 1.01%, the Option Strategies Index, with a 0.94% return, and the Fixed Income Arbitrage Index, gaining 0.47%.
Much more common were the sectors in negative territory in February. Among them were the Emerging Markets Latin American Equities Index, down 8.20%, the Pacific Rim Equities Index, off 6.48%, the Emerging Latin America Index, losing 6.22%, and the Emerging Markets Global Equities Index, down 5.77%.
Hedge fund sectors’ year-to-date picture was similar to their monthly performance in February, with the losers far outnumbered by gainers over the year’s first two months. Among the many hedge fund sectors in the red year-to-date were the Emerging Markets Latin American Equities Index, down 9.18%, the Emerging Markets Global Equities Index, off 8.67%, the Emerging Markets Latin America Index, losing 7.81%, and the Pacific Rim Equities Index, down 6.31%.
Among the gainers, the Convertible Arbitrage Index led the way with a 1.61% return through the end of February, followed by the Volatility Trading Index, up 1.57%, the Fixed Income Arbitrage Index, returning 1.35%, the Option Strategies Index, gaining 0.86%, and the Merger Arbitrage Index, up 0.06%.
For a complete table of BarclayHedge Hedge Fund and Sub-Index results for February, as well as historical returns, click here.
IHS Markit has hired asset management technology expert, Brett Schechterman, as Global Head of thinkFolio, its cross-asset class investment management platform. Based in Chicago, IL, Schechterman will report to Andrew Eisen, Senior Vice President and Head of Solutions.
Schechterman brings deep understanding of institutional portfolio management, workflow and technology solution development to thinkFolio. His experience, built over a 20 year career, ensures that thinkFolio will continue to develop the innovative tools and technology required to solve today’s complex front office operational and analytical challenges.
Brett spent more than half his career with leading, global asset management firms. He was head of Fixed Income Platform Solutions at UBS Asset Management and also held senior roles at Legal & General Investment Management America and Goldman Sachs Asset Management.
He joined IHS Markit from Rimes, a data management and regulatory solutions company, where he was North American head of product. Earlier in his career, Schechterman worked with other buyside technology providers, including BlackRock Solutions and Bloomberg.
Commenting on the hiring of Schechterman, Eisen said, “We are thrilled to welcome Brett to IHS Markit. His unique perspective on user requirements and understanding of the partnership between leading technology providers and clients creates exciting opportunities for thinkFolio. Brett will work closely with our leadership team to further integrate thinkFolio with our broader suite of best-in-class software and managed services solutions.”
Schechterman said, “I’m delighted to join IHS Markit at a time when we have exciting opportunities to deliver additional value to customers through the integration of thinkFolio with our other leading cross-asset software and data solutions. By continuing to emphasize our core portfolio modelling and decision support strengths, modular flexibility and capacity to leverage interoperability themes across the investment lifecycle, I’m confident we will present a unique and attractive proposition to the market.”
thinkFolio, from IHS Markit, is a leading multi-asset investment management platform delivering sophisticated capabilities across Portfolio Modelling, Order Management & Trading, Cash & FX Management, Compliance and the Investment Book of Record (IBOR). The platform can be implemented as a managed service, supporting investment firms that want to reduce costs, maximize flexibility, enhance scale and achieve time-to-market objectives.
Money exists to serve a fundamental purpose as a medium of exchange for goods and services. A central authority designates a certain currency as ‘legal tender’ and people can proceed to trade with it, trusting in its function as a unit of account and a store of value. Simply put, the traditional system of money thus far has revolved around four main participants: governments, central banks, intermediary banks, and users of money. It’s a system that has been built over centuries—one not easily dismantled or replaced, as significant cost and physical infrastructure has been put into supporting its integrity and performance.
Changing the game
Neeraj Khandelwal, CoinDCX
Relatively speaking, traditional money and the financial system it runs on have weathered much of the digital revolution unscathed. Rather than changing to fit the times, digital technology has been integrated around the usual way banks and financial institutions function, leaving the underlying fundamentals of the system untouched, along with its inherent inefficiencies and costliness. To say that legacy finance is now under threat, however, might be to jump the gun; nevertheless, we can see some challengers to the status quo emerging, as technology advances and becomes a more pervasive part of human life.
Cryptocurrencies have been lauded as one of the biggest game-changers within the centralized system of banking and finance. With the distributed ledger that underpins cryptocurrency, decentralization and disintermediation is made possible, and instead of a centralized entity validating transactions, the process is distributed across a network of validators. In a truly decentralized financial system, the middlemen and their fees are cut out, while the speed and efficiency of transactions are greatly improved. Clearly, such a system would be able to directly challenge the function and use of the traditional financial order.
Good governance and incentivization
While the technical aspects of cryptocurrency and distributed ledger technology have moved beyond theoretical whitepapers and into real-world applications, relatively little attention has been paid to the economic relevance of cryptocurrencies and the forces that govern the price and value of digital assets. Called cryptonomics, tokenomics, or just token economics, this field of study focuses on how incentivization and validation is used to encourage token adoption and subsequent ecosystem building around that token. While the utility of fiat currencies is largely limited to exchange and trade, crypto tokens can be put into service in a myriad of ways, and token economics explores the use cases of digital assets beyond their utility as currency.
There is so much to unpack when trying to understand the forces that govern functioning crypto ecosystems. Crucial issues, such as the incentives for blockchain participants to cheat or the endogenous value of a token in exchange, are still poorly understood and yet are pivotal to understanding the optimal design for a mainstream blockchain-based form of payment. How should a system be built to reinforce desirable behaviors amongst users, while discouraging cheating and market manipulation? Any platform looking for longevity and sustainability in a fast-changing industry must ask this question first and foremost. Currently, most cryptocurrency platforms incentivize users to perform governance decisions by awarding them newly-mined cryptocurrencies. They manage the rate at which new units are created to keep the supply of available tokens in check; therefore, the total amount of currency in the system is limited by the protocols written by the creator of the blockchain. Having these limits in place creates an impression of scarcity amongst users that allows the system to maintain the value of the crypto token.
Breaking the rules
It is this quality of scarcity that breaks the rules of inflation that already govern legacy money standards. Under the forces of inflation, the power of money to buy the same basket of goods is expected to be less in the future compared to today. These same forces do not have to apply to cryptocurrencies; not when they offer an opportunity for monetary experimentation and the potential for new ways of managing monetary supplies. Major platforms like Ethereum place community governance of token supply at a higher priority to maintain the ethics of a decentralized system, while privatized foundations of cryptocurrencies like Binance and VeChain use coin burning techniques to limit supply and temporarily increase the value of tokens. Essentially, the supply and value of a given digital asset is dependent upon the participants of the network and the algorithm it is built on, which places cryptocurrencies largely outside of the influence of geopolitical flux that otherwise affects traditional markets. For this reason, people from Venezuela and Argentina—both countries experiencing hyperinflation—are putting their money into bitcoin and other digital assets to hedge against the risk of inflation in the traditional market.
As the industry moves on from the crypto hype and market correction of the past, it has become clear that decentralized finance holds incredible potential for the global financial and economic system. The technology is constantly evolving, but sound principles of business and a strong token-flow model are more necessary than ever to keep the industry sustainable in the long-run, particularly in the face of tightening global regulations on crypto tokens and exchanges. Governance, incentivization, revenue sharing, and accessibility are all crucial metrics to consider before building an economic model for digital tokens and cryptocurrencies.
In the coming years, we can anticipate a future where both tangible and intangible assets are tokenized and easily used in real-time transactions on decentralized platforms and exchanges. We are on the precipice of a new global economy, one that is undergoing massive transformation. The steady development of decentralized finance, regulatory clarity, crypto-specific taxation policies, and central bank digital currencies are all positive steps towards shaping the new financial ecosystem—a decentralized token economy characterized by greater accessibility to financial services, safer transactions, and lower transaction costs. With full decentralization on the horizon, it’s becoming apparent that the face of global finance will never be the same again.
Neeraj Khandelwal is Co-founder of CoinDCX, India’s largest cryptocurrency exchange


 What are the inherent philosophical differences between a Round Earther vs a Flat Earther?