


Whats the best minquant?
For years, brokers and exchanges have been fielding some variant of this question from the buyside. But while many practitioners have personal rules of thumb, its a tough question to answer empirically because few have the data to evaluate the effectiveness of different strategies. Until now.
Why use a minimum quantity?
So whatisthe objective of using minimum quantity? Firms have a variety of specific reasons for using a min quant, but it really all comes down to limiting exposure to intermediaries. And the data backs this up?-?our analysis shows that liquidity adders typically receive better markouts when the liquidity taker is not a proprietary trading firm.
Of course, some intermediaries play a useful role?-?bona fide market makers tighten spreads and can offer material price improvement?-?but they all have a finite risk limit and can only trade so much with a given investor or broker. Put simply, if you are a large buyer and buy from an intermediary often enough, that intermediary will eventually have to cover its position, making it a buyer like you. As a buyer, that intermediary will likely be more adept and potentially less patient than you, meaning they could impact the stocks price and availability bybuying before youre finished buying. On the other hand, if, as a large, natural buyer, you transact with natural sellers who are not looking to cover, there shouldnt be a ripple effect after the initial transaction.
The problem is that min quant does not allow you to directly filter out intermediaries, since naturals also trade in small sizes. So how can you avoid throwing out the proverbial baby with the bathwater?
Exchanges can help withdata
Unfortunately, naturals cant effectively experiment with min quants because they dont know who theyre trading with or who theywouldhave traded with if they didnt use a min quant. Analyzing different min quant strategies requires raw data on orders and trades from both buyers and sellers, and the types of firms theyre from.
As a marketplace, IEX has the marketable order data and the trade data, and the firm types[1] for each, so we are in a unique position of being able to back-test min quant models to gauge how effectively they filter out intermediaries and small-sized natural flows.
How IEX tested min quantmodels
We tested two kinds of min quant models against a baseline of all marketable orders[2] or all trades,[3] using one month of IEX data. (August 2017)
- 300 shares: A static minimum quantity of 300 shares
- Dynamic models: 5%, 10%, 15%, 25%, 50% of the median NBBO size, set on a symbol by symbol basis and rounded down to the nearest round lot and with a minimum of 100 shares
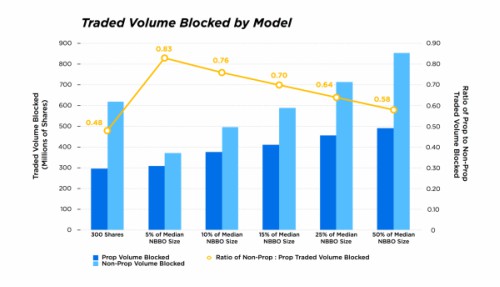
First, we looked at which marketable orders would be prevented from trading by various min quant values. Then, we also independently looked at whichexecutedtrades would have been prevented with each model. Analysis using trades is an important way to stress-test the models, because the order data can over-inflate the effectiveness of the models at filtering out proprietary traders, who are more likely to send multiple marketable orders in the same symbol and side during narrow trading windows. Those orders wouldnt all execute even without a min quant.
In both tests, results are grouped by orders or trades prevented from proprietary trading firms and non-proprietary trading firms, and all results are compared to a baseline of all marketable orders received by IEX or trades done at IEX. For the purpose of these experiments, we were looking for models that maximized the orders and trades prevented from proprietary trading firms while minimizing the orders and trades prevented from non-prop firms.
Putting standard practice to thetest
A static 300 share minimum quantity is a common rule of thumb in the industry?-?300 might be big enough that proprietary traders would not want to execute orders that large, but not so large that it would filter out other investor orders.
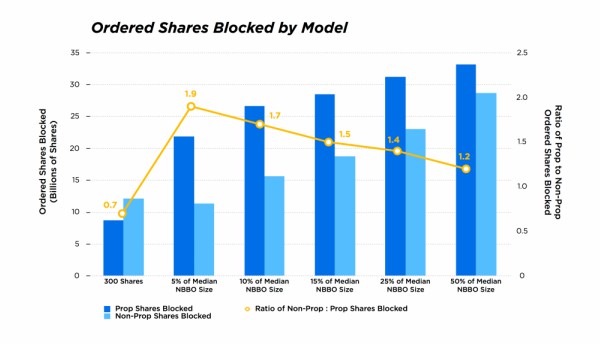
At first, the data seems to support that. In our test data set, a 300-share min quant would have filtered out 12% of all incoming order volume, including 21% of order volume from proprietary trading firms and only 9% of order volume from non-proprietary firms. The filter does affect a larger percentage of prop order flow than non-prop order flow.
But looking at the actual number of shares affected tells a different story. In absolute terms, a 300 share min quant would have blocked 8.8 billion prop shares and 12.1 billion non-prop shares. Blocking.7 shares of prop flow for every share of non-prop is not a good tradeoff! Because IEX has a high percentage non-prop flow, blocking 9% of those orders turns out to be too big of a trade-off. The data looks even worse when looking at trades.
We found awinner
Clearly, effective use of min quant requires a more precise, tailored method. Which makes sense?-?a 300 share hurdle doesnt affect trading in every stock in the same way. For example, in a highly-liquid name like SIRI, nearly 30% of IEX trades are at least 300 shares. Conversely, even in a moderately-liquid stock like COST, that number drops to 4%. So in a more heavily-traded stock, a higher minimum quantity still leaves a lot of liquidity available while blocking more prop flow at smaller order sizes. On the other hand, a higher minimum quantity in a more illiquid name may end up blocking a lot of valuable non-prop orders in smaller sizes, leaving very little available liquidity in those larger sizes.
With this in mind, we looked at a number of different possible models, and finally narrowed it down to one: percentage of median NBBO size.[4] Our symbol-specific model looks at how much displayed liquidity is typically available at the bid or offer and sets the min quant for that stock as a percentage of that amount, rounded down to the nearest round lot and a minimum min quant of 100 shares. This means that highly-liquid names have a higher minimum quantity, while more illiquid names are protected by a 100 share min quant. There is nothing inherently better about median vs. mean book size?-?what matters is picking a value that sets a minimum quantity proportional to the book size.
This approach is leaps and bounds more effective than a static 300 share min quant. Even the more aggressive forms of this model?-?setting min quant as 25% or even 50% of median book size?-?dramatically outperformed the 300 share min quant when looking at both the absolute volume of prop shares blocked and the ratio of prop to non-prop shares blocked. And this held true for both orders and trades.
But the best option we found was the least aggressive form of this model: 5% of the median NBBO size. This model filtered out 21.8 billion shares of prop order flow at a cost of only 11.3 billion shares of non-prop?-?blocking 1.9 shares of prop orders for every share of non-prop blocked. It actually blocked fewer shares of non-prop orders than the 300 share min quant while blocking more than double the number of prop shares. On the trade side, the 5% model was also the best option, preventing 308 million shares of volume from prop at a cost of 371 million shares of non-prop?-?a ratio of.83.[5]
Trade-offs and pay-offs from a data-driven min quantstrategy
So what does this mean for a trader who is looking to choose a min quant value for a given order?
For the more heavily-quoted names like BAC, F, or SIRI?-?where the book size is 4,000 shares or greater?-?5% of book size will net min quantity values in excess of 100 shares. For those stocks, setting a higher min quant is needed to filter out prop, which tends to send larger orders in these names. Keep in mind, 5% of median book size is a de minimis threshold for most stocks, not even amounting to a round lot. That means that for most symbols, this model uses a static value of 100 to block odd lot fills which are more likely to come from prop firms and may be used to identify the presence of large orders.[6]
Ultimately, a min quant of 5% of median book size will not be right for every situation, depending on how a trader wants to balance filtering intermediaries with the cost of blocking some non-prop flows. Traders should understand how different min quant strategies impact the dynamics of that tradeoff, and choose a min quant that fits the particular circumstances.
But if you are looking for a rule of thumb for filtering prop volume without losing too much non-prop, the data shows that 5% of median book size is a simple, reliable option that improves markouts on IEX significantly. If you are interested in a more detailed discussion of the data, please do not hesitate to reach out.
Questions? Send them toblog@iextrading.com
[1] Firms trading on IEX self-classify as proprietary trading firms, full-service broker dealers, agency/retail broker-dealers, or exchange affiliate routing broker dealers.
[2] All orders that are submitted to IEX which are at least marketable to the midpoint of the NBBO or more aggressive, regardless of whether they traded.
[3] Only trades where the resting order was either a midpoint or discretionary peg order were considered.
[4] Median NBBO size is a symbol specific figure and is calculated as the median of the (NBB size + NBO size)/2.
[5] There are a few potential reasons that none of the models prevented more shares of non-prop volume than prop volume when looking at trades rather than orders. First, IEX has a lower percentage of absolute prop flow than many other venues, so there is less low-hanging fruit to filter out. Additionally, some flows from firms who self-classify as non-prop on IEX may actually represent prop interest entering the exchange via sponsored access, so the data here should be considered a lower bound on efficiency. The ratios may be more favorable on venues where proprietary trading firms dominate.
[6] Van Kervel, Vincent and Albert J. Menkveld, High-Frequency Trading around Large Institutional Orders. Journal of Finance. (June 18, 2015; revised February 21, 2018)https://papers.ssrn.com/sol3/papers.cfm?abstract_id=2619686
Eric Stockland is Chief Strategy Officer of IEX