


If I know four of your credit card transactions, I know all of your credit card transactions. A scary but true statement based on a research paper titled Unique in the shopping mall: On the Re-identifiability of Credit Card Metadata.[1] Another study, Health Data in an Open World[2], discussed the unintended re-identification of patients in a heavily masked dataset of 2.9 million Australian citizens that was made public with the goal of transparency for the communal good.
In the former instance, a group of researchers developed an algorithm that can identify an individuals credit card transactions with 90% accuracy from a database of masked purchases transacted by 1.1 million people–by only knowing four transactions. The researchers didnt even have full transaction data, but only location and date. When relatively wide price ranges were added, the accuracy increased to 94%.

From just this skimpy amount of input, these analysts were able to pick out a single consumers activity across tens of millions of masked transactions in this data set.
The ability to identify a user in a larger, anonymized dataset is called unicity. The higher the unicity of a data set is, the easier it is to identify that user. The unicity of a credit card data set is extremely high. In this blog post, we will do a basic exploration of the unicity of algorithmic trading.
Our Test
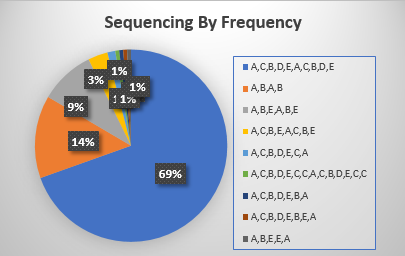
We observed the following from one of the commonly used algorithms in the data set. 69% of the time, this algorithms first four steps were to go to venues A, C, B, D, E, A, C, D, B, and E. Note that this algorithm went to multiple venues at the same time, which is why there are more than four venues listed. Another 14% of the time, it went to venue A, then venue B, then venue A again, and finally venue B. None of these patterns are found elsewhere in our data set. All eight of these patterns were only used by this broker and this algorithm. Any algorithm with a starting pattern of A, C, B, D, E, A, C, D, B, and E can only be this algorithm and broker. This algo had such a high degree of unicity that if you only looked at the first 3 steps, which involved going to A,C,B,D,E,A almost 70 percent of the time, you still will not find another example in the data of a different algorithm going to those venues in that sequence.
We observed the following from one of the commonly used algorithms in the data set. 69% of the time, this algorithms first four steps were to go to venues A, C, B, D, E, A, C, D, B, and E. Note that this algorithm went to multiple venues at the same time, which is why there are more than four venues listed. Another 14% of the time, it went to venue A, then venue B, then venue A again, and finally venue B.
None of these patterns are found elsewhere in our data set. All eight of these patterns were only used by this broker and this algorithm. Any algorithm with a starting pattern of A, C, B, D, E, A, C, D, B, and E can only be this algorithm and broker.
This algo had such a high degree of unicity that if you only looked at the first 3 steps, which involved going to A,C,B,D,E,A almost 70 percent of the time, you still will not find another example in the data of a different algorithm going to those venues in that sequence.
We decided to see if a similar degree of unicity existed in our data set (described below.) We conducted a simple experiment[3] to see if we could identify broker algorithms using only the first four destinations and sequence of those destinations. Lets assume that algorithm PUDDLE CHOMPER starts searching for liquidity by sending orders to the NYSE, followed by sending orders to BATS, EDGX, and EDGA. If PUDDLE CHOMPER is the only algorithm in our data set that follows that pattern, then starting a client order by sending orders to NYSE, then BATS, EDGX, and EDGA is a fingerprint of PUDDLE CHOMPER. The implication is not that PUDDLE CHOMPER has only one fingerprint, merely that each fingerprint it has is unique to PUDDLE CHOMPER.
We used Apache Spark within our Amazon Web Services (AWS) environment to perform this analysis. This is important to point out because the resources required to do this analysis are minor. The total spend for the resources in AWS is approximately the price of a cup of coffee and a year of a clients data returned results instantly. This is a fairly modest setup compared to the vast technology used by proprietary trading operations.
Our Routing Data Set
The data that we collect on behalf of our clients at Babelfish contains the complete history of an order from the time the broker receives the order until the time the order is completed or cancelled. We capture every action a broker takes over the course of said clients algorithmic strategies, which is the complete audit trail. This includes not only the trades, as traditional TCA captures, but the routes the broker sends to different venues that are unfilled, the limit prices, the order types, and more information. One order may have thousands or even tens of thousands of events, transacting at different venues and exchanges. This data provides a complete view of how the algorithm works and allows us to attribute costs to specific and detailed actions.
The First Four Routes
There was a high level of homogeneity in the first four actions for all brokers. Bulge brokers almost always included their own pool in the first four routes, as well as additional preferred partners. Agency brokers have other patterns, sometimes guided by destination size. Although the first four actions for each algorithm was not always the same, the patterns for each algorithm were unique and identifiable. We discovered that while each algorithm has a unique pattern, there were identifying markers within each algorithm that made them highly recognizable just by understanding the first four actions.
The magnitude of costs is dependent on many things, but unintended information leakage, or information leakage that was above and beyond what was expected, is one of the most expensive mistakes that a trader can make when executing an order. Our data shows that there is a relationship between unicity and information leakage and the higher the unicity, the higher the unintended information leakage. This information leakage causes inferior prices to be obtained and negatively impacts alpha.
Consider how you, as a buy side trader, would change your execution strategy if you are working a large order and are able to identify that there was another order in the marketplace using the PUDDLE CHOMPER algorithm. Now assume you are free from the constraints of being a buy side trader and are able to trade both sides of any security – do you think you will be able to profit from that information? Of course you can and you dont even need to have massive computing power and low latency connections to all execution venues.[4]
The Exceptions: VWAP & TWAP Algorithms
Scheduled algorithms, such as VWAP (volume weighted average price) operate differently than liquidity seeking algorithms. These algorithms rely on spread capture and the most common way for brokers to capture spread is to provide liquidity on listed exchanges. In return for providing liquidity, the broker will receive a rebate when the trade executes rather than paying a fee (there are venues where the brokers pay to post, but those have a minor amount of market share). The rebate paid varies by exchange and a broker algorithm that takes these rebates into account can add another source of revenue to the broker.
There are certain specific patterns used to maximize rebates. As a result, it should be no surprise that VWAP algorithms exhibit a much lower level of unicity than their liquidity seeking counterparts. Patterns that involve starting at the high rebate exchanges are fairly common in our universe. This causes a different set of problems for parent level order performance.
What does this mean in the real world?
We skipped a few cups of coffee and spent a few days running and analyzing our simple experiment, which we proved that broker algorithms can be easily identifiable from their first four routes. As discussed in both of the studies that we referenced, in the real world, much more data is available that will enable sophisticated counterparties to not only understand your routing strategy, but to jump ahead and move the price against you, causing unintended information leakage[5]. The rich metadata inherent in your routing behavior is both explicit and derived, like security, whether you are providing or taking, order type, routing origin, limit price, not to mention the probabilities that behaviors will change in a particular manner. The counter-algorithm on the other side of your algorithm will peg your route and work against you.
We have seen traders countering this unintended information leakage by frequently tweaking algo behavior when the algo does not behave as expected. Limits and parameters are adjusted, or orders were pulled and moved to different algos, causing the trader to act as a human algorithm, micromanaging algo logic sometimes to the point where the algo is abandoned completely in favor of a DMA solution. expected
Based on our experience, we have seen implementation shortfall remain flat to rise slightly over the past few years. These band-aids were complicit in artificially inflating costs because instead of pushing brokers to develop tools that lower trading costs, this twisted trader workflow is masking the problem.
Further fueling the problem is that the widespread tweaking is rendering the TCA analysis based on data that comes out of OMS systems, which are final state and do not capture limit changes or unfilled routes, detached from the reality of actual events. The consequence will be that when tighter limits are imposed or an order was pulled because of poor algo performance, the underperforming broker will show lower IS. The clean-up broker with the better algo will typically have higher IS because they will have a looser limit and sometimes are working with a triggered market. Most broker report cards are not designed to capture this issue and traditional TCA is distorted.
Although labor intensive, the trader has the right idea-be unpredictable. Many algorithms have entrenched predictability that causes unintended information leakage. Likewise, many strategies considered safe, for example resting in a friendly venue for an extended period of time, suffer from the same problems. Analyzing routing data is the only way that traders can better understand which algorithms are behaving effectively and to start down the path of fixing their existing tools, finding new ones, or even building their own. Considering the immense value in ferreting out live counterparties, the buy side must understand that by failing to understand the technologies that they are up against and taking proactive action to preserve stealth, they are bringing a proverbial knife to a gun fight.
Jeff Alexander is Founding Partner at Babelfish Analytics, Inc.
References:
[1]Science, 30 Jan 2015: Vol. 347, Issue 6221, pp. 536-539, Yves-Alexandre de Montjoye, Massachusetts Institute of Technology (MIT), Laura Radaelli, Aarhus University, Vivek Kumar Singh, Rutgers University, Alex Sandy Pentland, Massachusetts Institute of Technology (MIT),http://science.sciencemag.org/content/347/6221/536.full
[2] Chris Culnane, Benjamin Rubinstein and Vanessa Teague, School of Computing and Information Systems, The University of Melbourne, 18 Dec 2017,https://arxiv.org/ftp/arxiv/papers/1712/1712.05627.pdf
[3] We used a sample set containing data for liquidity seeking algorithms from six different brokers. We included only the algorithms with significant sample sizes.
[4] While a discussion of how a counterparty will identify and profit from your order is out the bounds of this short blog post, please contact us if you want more information and we will be happy to walk you real world examples.
[5] Some level of information leakage should be expected. Estimation methods vary, but the trader should have an expectation of acceptable price movement.