


This is an edited version of keynote delivered at the Big Data Finance Conference held at NYU 5/19/2017
INTRODUCTION
I must say it is a daunting experience not only to be addressing this audience, but to be following such a distinguished list of panelists and speakers with such clear thinking about the future of Big Data.
My charge, as you may have read, is to discuss the use of big data in fixed income.

I am going to do that by trying to provide some perspective on how we got to where we are today. Because the path that brought us to this point. Right now. Is already defining our future.
I am going to do this as a market participant who believes that what is good for the debt markets, is good for society. We need to move past soundbites, and the idea of good guys vs bad guys so that we can really understand the drivers of the markets momentum and make objective, better informed decisions about our individual roles.
I also believe that, collectively, we have the potential to not only influence the long-term stability of the largest that market in the world-almost $14 trillion in size-but also support its role as the risk-free interest rate for a multitude of global markets.
There should be no confusion in this room about the global importance of our debt market, and what the implications would be if we do not protect its long-term health.
Those outside this room, unfortunately, were reminded of this fact during the financial crisis of 2007-08, when a $75 billion sub-prime mortgage market setting anything but the risk-free rate, almost took down the entire global economy.
Selena Gomez does an outstanding job simplifying how all this happened in the movie The Big Short based, of course, on Michael Lewis best-selling book by the same title.
The U.S. Treasury markets potential impact on finance and the worlds economy is not to be taken lightly. That is why big data, within this market segment, is so important, and why-we, as participants in this market-may quite literally have the whole world in our hands.
WHY ME?
But before I take you down this road, I am going to ask you to indulge me for a minute to explain why I think Im uniquely qualified to do so.
As a long-term student of the market and market structure, the markets have fascinated me from the first day I stepped into my first job, in 1981, as a runner in the South Room, at the Chicago Board of Trade. Back then financial futures were in their infancy. The GNMA contract was failing and 30-years bond futures were just being introduced. 1981 was basically the Big Bang for the bond market, so in that sense, I was there for the birth of our present world.
Certainly, you can read about it. But regardless of your choice of material, reading cannot replicate the lessons learned from living it.
I have been immersed in it for the better part of the last 35-plus years. That said, I am not attached to history. I do not pine for the good ol days. These will be the good ol days many of you will look back on and reference, as the years when big data was just in its infancy.
It is a brave new worldandmany are just waking up to what this may mean for the debt market.
Im grateful to be here today, not just as a witness, but also as a market participant. In years past, I leveraged data, with far less efficient tools than we have today, in order to make some significant, and very successful macro bets on the market. Today, OpenDoor, represents the largest macro bet I have ever placed. It is a bet many years in the making, and data plays a very large role in that bet.
If I do this right, you will exit this room just as excited about the potential of big data as when you entered, but with a more informed perspective about the health of the largest debt market in the world, and the surprisingly lack of significant clean data with which to evaluate it.
And you will also leave with some level of consciousness as to whether your contribution, or your firms contribution will have a stabilizing or destabilizing impact as we move forward into this world of big data, in which statisticians, physicists and data scientists have never been as hot a commodity.
WHOS YOUR DADDY?
Lest you all run from the room in terror, I will speak, rather than sing, the Zombies melody that came to mind when preparing for this discussion:
Whats your name? Whos your daddy? Is he rich, is he rich like me?
The fixed income market is the big daddy of the financial markets. It doesnt matter if you measure it by number of products, or by volume, it is several times larger than the equity market. It is also far more complex.
In the equity market, if you want to trade GE stock, you are buying the exact same instrument as everyone else. However, if you want to invest in a GE bond, you will have hundreds to choose from. Each with a different maturity, possibly denominated in different currencies, and each offering its own level of risk and return.
There is one part of the debt market, however, where the complexities are different and one that produces a nearly incomprehensible amount of data daily. I am, of course, speaking of the U.S. Treasury market, which by volume makes up about 32% of the total domestic debt pie (slide 1).
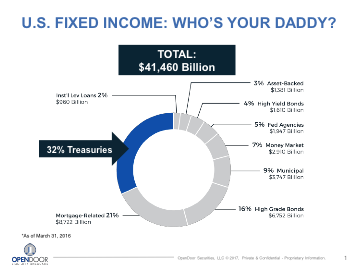
So, its a huge market. $13.9 trillion huge.
In every speech delivered by a Fed or Treasury official, or politician, the U.S. Treasury market is always described as, The largest and most liquid debt market in the world. Treasury prices and yields also happen to be the linchpin of the entire financial system, the risk-free rate to which all other global interest rates are linked to in one way or another.
But unfortunately, largest and most liquid is not synonymous with structurally sound. At least not in our present, post-crisis world.
The unsettling truth is that the U.S. Treasury market, the market upon which layers upon layers of risk are priced globally, is structurally damaged. And regardless of your job, it is likely that you will be affected by any fallout from its flaws.
UNDERSTANDING BASIC MARKET STRUCTURE
Understanding market structure, and possessing in-depth product knowledge, are critical elements to successfully leveraging any dataset. Market dynamics matter a great deal.
We all know that Data scientists use their market knowledge and expertise to cultivate data. And the Data they cultivate, then guides machine learning techniques, with the goal of extracting predictive insights from that data.
But what data sets are available in the largest and most liquid segment?
How deep are we able to dig today?
The answers to these questions largely depend on who you are and what you are looking for, because the Treasury market today is severely bifurcated.
Post-crisis, the Treasury market has evolved into two very separate and distinct market segments with decidedly different liquidity profiles. On-the-runs (OTRs), which are the six most recently issued government bonds, and off-the-runs (OFTRs), which are, basically, everything else. In other words, OFTRs represent everything but the six most recently issued securities. Thats a bundle.
Lets take a look at this bifurcated market.
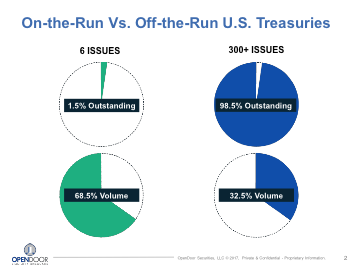
The six OTR benchmark issues represent just 1.5% of total outstanding Treasury issuance, yet they generate over 68% of total trading volume.
And that is because trading in these issues is largely dominated by high-frequency trading firms, employing algorithmic trading strategies. These firms, and these issues trade fully electronic, with high visibility and produce endless amounts of tic data.
By contrast, the OFTRs, make up the remaining 98.5% of Treasury issuance, over 300+ issues, but account for just 32% of average daily trading volume.
To put that in perspective, thats almost 60 times the number of issues, with only one third of the trading activity. By one measure, that would mean that a typical OFTR security would be about 180 timesless liquidthan its OTR counterpart.
OFTRs are traded, to the degree that is possible, by real-money investors. Real money investors are the participants that play a significant role in underwriting our nations debt. OFTRs trade by voice, or electronic auction, with limited visibility, and very little reference data. And, the data sets that are available, are flawed.
Let me be clear, I just said that 98.5% of the largest debt market in the world, lacks sufficient data, to give even our regulators or policy makers a reasonable view into its workings.
I find this remarkable and so should you.
WHATS YOUR DATA?
Data scientists, statisticians and coders, can apply state-of-the-art analytics to financial data and come to some very powerful conclusions. But, regardless of the quality of their effort, at the end of the day, their findings are only as accurate the data sets they rely upon.
Today I am going to share with you several real-life examples of how easy it is for even the best and the brightest can be misled by flawed data, causing them arrive at some very misleading representations about the markets they are analyzing. In doing so, I may take away your life preserver, and move you out of your comfort zone, and as I do so, keep in mind I am addressing issues in what is arguably theleastcomplex of all fixed income market segments.
CASE STUDY 1: The Academics
Just under two-years ago, I was in the process of trying to secure capital for OpenDoor. During the capital raise, I found myself in deep discussions with a merchant bank that began conducting due diligence, trying to get a handle on the market share of off-the-run Treasuries. And in this process, I was emailed several pieces of research for my review.
One paper, titled Automation v Intermediation: Evidence from Treasuries going OFTRwas written in 2003. And before you dismiss it out of hand, let me tell you that reason I was asked to comment on a then 12-year old white paper was because it was one of very few, even as recent as 2015, that specifically referenced OFTR volumes.
Anyway, it was authored by professors from Cal Berkley, who gave attribution to among others, Forensic Economics, The National Science Foundation and Stanford University, with special gratitude expressed to Michael Flemming from the NY Fed.
Michael is a Vice-President and Financial Economist in an area of the Markets Research and Statistics Group that evaluates Capital Markets. His primary focus is on market microstructure, financial intermediation, and monetary policy. I have spoken to Michael on several occasions, usually to discuss some Fed publication I have read, and I both like and respect him.
The papers abstract stated that when a Treasury security goes OFTR its trading volume drops by more than 90%.
90%. That is a startling statement. Think about it for a second: If that was true, it would truly suck for anyone but a day trader.
It would be like owning a previous generation Tesla.
If, for example, you were among one of the many the pension funds, sovereign wealth funds, insurance companies, mutual funds or foreign central banks-a true real money investor- and you just helped the US government fund itself by taking down billions of a 5-year note at auction. And then, 21-business days later, when the new 5-year note is auctioned and settles, your previously purchased 5-year note rolled off into some OFTR oblivion, devoid of 90% of its liquidity, making it very costly to sell, why would you sign up for that?
Well, the reasonably good news is that while in OFTR liquidity is certainly challenged, the statement that an OTR loses 90% of its volume, when it goes OFTR, is categorically untrue.
How did the subject matter experts get it so wrong? Simply put, bad data.
The data used was derived from records submitted to the Fixed Income Clearing Corporation, or FICC. The authors say specifically, the data contain virtually all transactions between member firms from, January 2001 through November 2002.
Now, the fact that the footnotes tell you the FICC was not even created until 2003, is not the problem. Prior to 2003, the data was collected by the GSCC which later merged into the FICC, but that is merely an unexplained oversight.
The problem with GSCC data was that it captured dealer to dealer trades only, and not dealer to customer trades. The GSCC simply did not have did not have categories or identifiers for the entities that were responsible for the bulk of OFTR trading, including insurance companies, mutual funds, foreign central banks or sovereign wealth funds.
The trades of these customers were processed through the Fed wire, not through the GSCC. This had the result of grossly understating the amount of volume in OFTRs, which in turn led the authors to commit a considerable amount of time and effort to produce a 36-page white paper that completely misrepresented the liquidity characteristics of OFTRs.
CASE STUDY 2: The Advisors
In late 2013, I was reading a presentation delivered to Treasury, by a member of the Treasury Borrowing Advisory Committee, or TBAC. If you dont know it, this Committee is comprised of up to sixteen industry experts, all serving by invitation.
The purpose of the committee is to advise Treasury on how best to fund its borrowing needs. They also meet separately with the Chairman and Board of Governors of the Federal Reserve to address topical issues in the economy.
The charge to the Committee for this presentation was to comment on HOW the increase of high frequency, algorithmic trading, in fixed income markets, had changed market dynamics, with specific focus on the Treasury market. In other words, the Treasury was essentially interested the same thing I was, AND with a clear focus: how much volume in OFTRs actually existed?
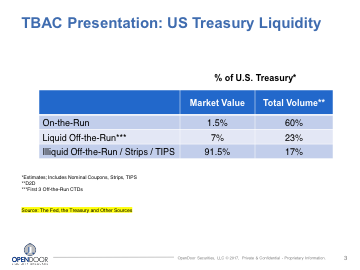
You are looking at a page taken from thepresentation itself(slide 3) in which the TBAC presenter pointed out that there were clear tiers of liquidity in the Treasury market, with 60% of trading activity in the dealer-to-client space concentrated in OTRs, and 40% in OFTRs. In addition, this presenter drilled down into more detail to liquid vs illiquid OFTRs, and stated that within that 40% bucket that 23% of OFTRs were considered liquid and the remaining 17%, illiquid.
Sources cited for this information were the Fed, the Treasury and other sources.
Now, I served on this Committee at the service of both Secretarys Snow and Paulson, so I understand of how it works. In addition, I previously managed global Treasury Trading operations for several top tier bulge bracket firms, so I am aware of the majority of data available.
I did not question the 60/40 volume split, but I was unaware of the data was available to break down liquiditywithinthe OFTR bucket. I was so surprised by the granularity, that I picked up the phone and called someone I have tremendous respect for and, personally like, the then Acting Assistant Secretary for Financial Markets, Seth Carpenter.
When Seth picked up, I asked him if he knew the source of the data for the presentation, and he referred me to the Director of the Office of Debt Management, who confirmed what I had feared; that the kind of granularity presented, DID NOT EXIST, at that time, within Treasury. I shared a theory I had with the Director that perhaps the presenter took data available from his or her firm and applied it to the entire market. The director was kind enough to offer to follow up and let me know.
A few weeks later, the Director confirmed by email that the data was, in fact, inferred from a siloed slice of the incumbent dealer market. The TBAC Committee member, took internal firm data, and used it as a representation of the entire market.
If you take the same view as this presenter, that your data can be extrapolated to represent the worlds view, you could be in for some disappointing results, and I will tell you why. The market is not homogenous and market participants are not homogenous either.
How comfortable anyone should be with the notion that one banks data can be easily applied to the entire market? My view is, not very. Concentration of trading, or trading expertise, varies considerably from dealer to dealer.
If you are thinking to yourself, Sure, but those are two isolated examples, especially the 2004 white paper, you are wrong and I will illustrate why in the next example.
CASE STUDY 3: The Official Institutions
Both the NY Fed and the US Treasury have noted the marked differences in data available for OTRs and OFTRs. OTRs have an overload of TIC data available through the inter-dealer broker market, and OFTRs well, dont.
The OTR tic data, while plentiful, is still limited to six issues. That small 1.5% slice of the entire issuance pie was, nonetheless, the data referenced by Treasury officials in its May 2016 blog, A Deeper Look at Liquidity Conditions in the Treasury Marketwhich concluded there was no broad-based deterioration in market liquidity after the financial crisis.
But rather than take my word for it, let me read you their words. If you want to, you can read them later, because as of this morning, the blog was still posted on Treasurys website.
Treasury said the following:
In summary, we find little compelling evidence of a broad-based deterioration of Treasury market liquidity using traditional metrics. However, as noted earlier, these traditional metrics are based on a partial view of trading conditions in the cash market-namely trading in OTR securities in the inter-dealer market
(which, they dont say, but I will, is 1.5% of all issues), and then they continued…
and thus, do not account for trading conditions in OFTRs, which are traditionally less liquid,
(which, again, they dont say, but I will, make up 98.5% of the largest debt market in the world).
They conclude with, Moreover, while traditional measures may be indicative of general market conditions, they may not capture other changes in liquidity conditions.
That is a disclaimer not suitable for cigarette packaging. The purpose of this illustration is not to criticize the Treasury, but simply to illustrate how subject-matter experts, and government officials can be easily tripped up by assumptions that begin with flawed or insufficient data sets, it should us all pause for thought.
ENOUGH ABOUT OFTRs
But enough about OFTRs, the largest segment of the Treasury market. The OTRs do produce volumes of data, so what is their value?
Well, honestly, I think about that a lot, but always in the context of market structure. And what I think is this, you can be data rich and still information poor.
In fact, the state of the largest debt market in the world, the U.S. Treasury market, is just that: Data rich and information poor.
I cannot emphasize this enough: The volumes of tic data that are presently available to our regulators and policy makers are based on a 1.5% slice of total outstanding issuance. Six issues. Thats it. Six issues which are dominated by HFT algorithmic driven trading.
Too often, it is derived data from these six issues, representing largely traders, that is used to give the world false comfort that the Treasury market is healthy, at the expense of the other 300+ OFTR issues, which have an entirely different liquidity profile, AND THAT MATTERS A LOT, because it is the OFTR segment that is held by Real-money investors, who are the true underwriters and holders of our national debt. The holders of the other 98.5%.
When I think about the 1.5% that is traded and not held, I think about aTed talk, given by Kevin Slavin. Kevin talked about how algorithms are quite literally shaping our world. He mentioned a company many of you are probably familiar with, Nanex. One thing, among a whole host of things, Nanex does is look for algorithmic patterns in financial markets, and when they find them, they put them into a graphic representation, that looks a lot like art.
But as pretty as these algorithms may be, when I think of the 1.5% that is traded and not held, I am left with a different visual that Kevin left strongly imprinted in my mind, and that is one of a bunch of algorithms programmed to hide, and then another bunch of algorithms programmed to find them and act before they do. And as he said, all of thats terrific, right?
Because when you think about it the context of the Treasury market, it is fine that we have liquidity in that 1.5%, but it has very little to do with the liquidity available in the other 98.5% which, after all, funds Americas infrastructure, defense, social security, Medicare, and education. To Kevins point, what could possibly go wrong?
Well, I would point to the October 2014 flash-crash, when all of Wall Street watched in collective horror, as the yield on the benchmark OTR US Treasury 10-year note, plunged significantly, beforecareering upward again, without provocation. No news. No announcements.
I would point to that, but the five top US governmental agencies, tasked with keeping our markets healthy, reviewed the tic data and could not identify a cause.
Data rich. Information poor.
So, what do market participants, with proper tools do with the nearly endless volumes of tic data, in such a small portion of this large debt market? They scrub it to find ways to build faster bots. They use it to trade. This is not your investors market. This small slice, represents a very active traders market. Completely separate, and distinct, from the other 98.5%.
DATA RICH, INFORMATION POOR
Tic data, with depth of book, has tremendous value to HFT firms that write the algorithms. And the volume created by these algorithms, has tremendous monetary value to the exchanges and big banks that service them. And then there is the liquidity premium assigned to the more liquid OTRs which, in certainly in the short run, allows the government to more cheaply finance our debt.
But I often wonder if we are missing the forest through the trees because the Treasurys stated mission does not stop with financing the government as cheaply as it can. It has a bigger mission.
Treasury is also charged with protecting the integrity of the financial system, including the liquidity of theentireTreasury debt market. If liquidity in the OFTR secondary market continues to evaporate at its current pace, down 20% in the last 2-years alone, I believe there will be a greater price to pay in the future.
Because what value does this volume of tic data from frequently traded OTRs offer to the pension funds, sovereign wealth funds, insurance companies, endowments or foreign central banks? The investors that have been long-term holders of OFTRs? Realistically? Nothing.
Now Im going to let you in on a little secret…just because these real money investors have longer-term horizons, that doesnt mean they will hold onto OFTR securities indefinitely.
This should matter to all of us, a lot, because if ever there is a need for more aggressive monetary tightening, due to say a surprise uptick in inflation, or if there were a surprise macroeconomic development, a large bankruptcy or some other systemic event, these investors will look to sell trillions of off-the-runs into an illiquid market that barely trades. That is a recipe for dysfunction, for which the consequences would be severe across many markets.
I will remind you that a $75 billion sub-prime market became so leveraged with layered bets that it nearly took down the global economy. Imagine the damage a dislocation in a market 185 times larger could do.
BUT VOLUME IS GOOD, RIGHT?
I want to impress upon you that volume does not replace depth of book, and tic data for 1.5% of the $13.9 trillion Treasury market does not provide any information on the structural health of the other 98.5%. And the playing field on which different types of Treasuries-OTRs and OFTRs-trade, is not level. Not by any means.
Somewhere along the line, as our official institutions and regulators were introducing new rules and regulations intended to protect the market from the banks that abused their ability to leverage, they were also buying into a notion that the less regulated and leveraged high-frequency trading firms, and their algorithms, created for the sole purpose of enriching their creators, were going to play a more reasonable role as market intermediaries.
And maybe they are right. After all, algorithmic trading is not new to the markets; it isnt even new to fixed income. In Treasuries, it has been around since the turn of the century. And ostensibly, HFTs do not intend to deceive, they simply seek a competitive advantage.
And Im all for them playing a part, because in all fairness, the Treasury market did not become this bifurcated and precariously skewed overnight. The asymmetry and concentration of technological skills, of data creation and data consumption, that divides the haves from the have nots, took time, it was many years in the making and was a team effort (slide 7)
WAIT, HOW DID IT HAPPEN?
This is how it happened. Blinded by greed, the largest financial intermediaries entered a competitive foot race with one another, each one testing the boundaries of leverage, taking it to new level, which, in turn, triggered the financial crisis which, in turn, scared everyone, especially those charged with safeguarding the financial system. Fear gripped politicians who held hearings which, in turn, gave regulators broad authoritative powers.
Regulations were then enacted to reduce leverage, in order to prevent another crisis. But that came with unintended consequences.
Regulations, which reduced incumbent dealers ability to warehouse risk, coincidently coincided with an accelerating arms race among HFTs, who, unconstrained by regulation, built faster and faster bots to compete against one another. This resulted in ever increasing volumes in OTRs, and increased competition among HFTs, which led to lower profits, the economics of which may only makes sense to this elite group, some of whom are now willing to risk $1000 to make 4 cents.
And there you have it. That is the markets evolution.
WE ARE HERE, BUT WE DONT HAVE TO STAY HERE
The present market structure, broken as it may be, reflected in both the liquidity bifurcation and the asymmetry in technological skills, is not the result of any grand design, but rather the lack of one. The latency arms race created volumes of data, but for the life of me, I do not see the value. Are they not picking up pennies in front of a steam roller?
I have used these illustrations to highlight how easy it is to be misled, deceived even, by data. There is an overriding perception that the U.S. Treasury market is structurally sound, and that is simply not the case.
Im going to leave you with three suggestions to keep in mind when you are working with your own data sets.
Within the market segments that should matter to all of us, the state of data today could be at best characterized as siloed, and at worst, non-existent. And there is no collective effort, even today, to repair what is broken. On July 10th, TRACE reporting starts for Treasuries. FINRA will begin to collect this information, but their methods of collection, and whom they are collecting it from, will ensure the picture remains opaque.
TRACE reporting for Treasuries will not provide our regulators a comprehensive view into top level data, a view that both UK and EU regulators have today, and that needs to corrected. FINRA will be collecting end of day data from reporting members only. And, if two securities trade against one another, on switch, as most OFTRs do, there is no requirement for the broker dealer to tie the two trades together. Each side will be submitted as a separate trade in the name of the broker dealer.
By contrast, regulators in the UK and EU get transaction reports on everything, from every market participant, as long it remains within the scope of market abuse regulation. That should be our goal, for our official institutions.
OPENDOOR
And by the way, this is essentially the premise of my company. OpenDoor was founded to bring more transparency, more liquidity and reduced transaction costs by introducing a neutral trading platform into a corner of the Treasury market that has been historically opaque: OFTRs and TIPS. We launched on April 25th, and to date have had $60+ billion in orders, with billions of matched trades*. At the first auction, buy-side crossed and matched with buy-side, resulting in better beneficial pricing to both accounts. But the platform allows for all variations within a level playing field: Sell-side is matching with sell-side and all the other various iterations and combinations. We have had mid-market liquidity in 85% of issues. Thats what we do, and if you want to hear more, feel free to find me during the reception.
GRAND DATA STRATEGY
OpenDoor desires to be part of the solution, but for the larger solution, the market needs a GRAND DATA strategy; one which brings the capabilities of our official institutions back in line with the markets they are responsible for monitoring. And, one focused on the creation of data sets that that are complete, and when queried appropriately, can provide valuable insights that will help drive policy-making. And when that happens, we will know that Big Data is being put to great use on behalf of the many, not in support of the few.
Thank you.