It was the best of times, it was the worst of times, it was the age of wisdom, it was the age of foolishness… it was the season of Darkness, it was the spring of hope, it was the winter of despair…
– Charles Dickens, A Tale of Two Cities
Over the past week, we have endured not one, but two brutal selloffs in crypto assets, causing depression among the crypto community and schadenfreude among its many critics. These moves were quite different from each other however, despite being of similar magnitudes with the same elevated trading volumes.
Using CoinRoutes data and software tools, we were able to analyze both moves and show that the first fall, which took place on the 14th of November, was likely triggered by a small number of large sellers, likely originating in the OTC market, while the second, which took place on the 19th, was much broader, more orderly, and likely originated on exchange markets.
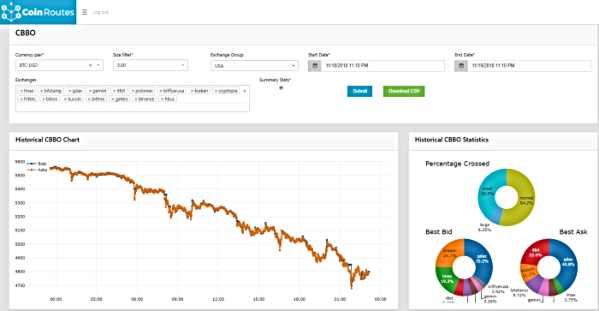
Selloff #1: November 14th
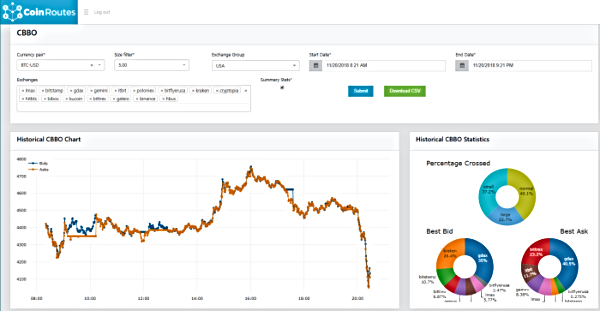
To start the analysis lets look at the chart of the key 12 hour period on the 14th: (This graphic shows the CoinRoutes Consolidated Best Bid and Offer for Bitcoin-US Dollars all the exchanges that accept US clients and trade directly in US Dollars. It also employed CoinRoutes size filter to only include bids and offers that were for at least 5 Bitcoin in order to exclude de-minimus quotes.
This move featured a large & sudden price drop that lasted just over 30 minutes, followed by several hours of significant volatility. Ultimately, the market made a bottom at around 5400 in Bitcoin-US dollars that lasted for several days. It is particularly noteworthy that, for the entire 12 hour period in the above graphic, the best bid was higher than the best offer by over 25 basis points. That is shown in the top pie-chart as Large crossed situations and it represents opportunities for arbitrageurs to profit from the differences between exchanges. Another noteworthy statistic is the fact that LMAX, despite a relatively low market share overall, was represented on the best offer almost 20% of the period. As LMAXs strategy is to aggregate market maker liquidity, this statistic makes it relatively likely that OTC trades left the market makers long bitcoin, with a need to sell during the fall. To dig deeper into this, we zoomed in on the chart to the time-period with the steepest drop:
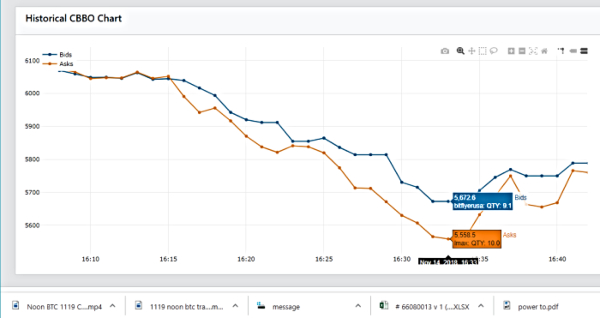
This chart shows that, during the sharp fall from 6100 to under 5600, there were substantial arbitrage opportunities. At the maximum deviation point, there was more than a $100 premium between the best bid and the best offer. At that point, and for much of the 30-minute period, the offering price that was leading the market lower was on LMAX. While this is not conclusive proof that OTC trading triggered the fall, the sharpness of the fall would suggest that many professional traders were reacting to market changes simultaneously, so it is relatively likely to have been the case.
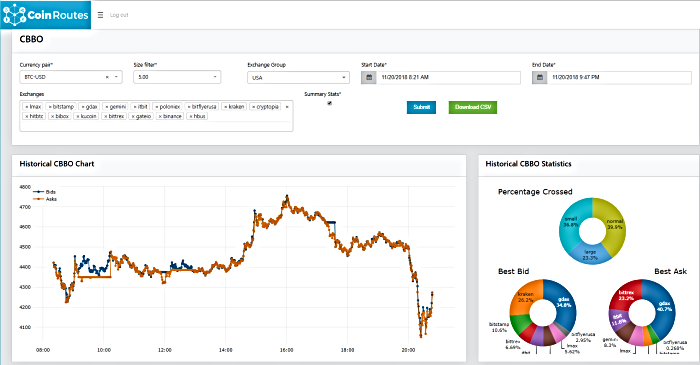
Selloff #2 November 19th
The chart of the November 19th selloff is quite different from the previous chart, however. It does not feature an individual fall as sharp as in the earlier selloff, but is rather a steady slide of even larger magnitude as shown here:
Notice first how the selloff is an unrelenting slide, without any particularly steep sections, except a bit towards the end of the period. Second, notice that the upper pie-chart shows that arbitrage opportunities existed for a much smaller percentage of the time at 6.25%. Third, notice that the market makers, as represented by LMAX, were biased towards the best bid and not the best offer during this period. All of these things, taken together, is suggestive of more broad based selling as opposed to being driven by large transactions done in the OTC market.
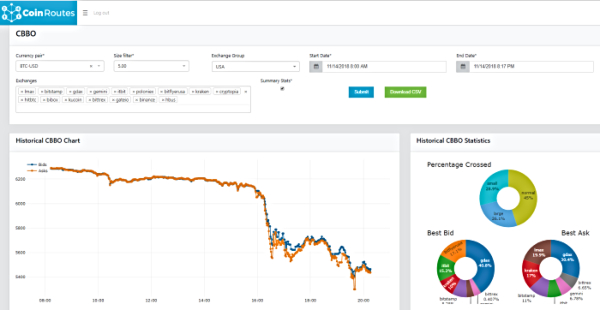
Perhaps more importantly, there was also no evidence of a capitulation bottom in the market during yesterdays selloff, although, as I write this commentary, that might be taking place. Todays price action has featured significant volatility and could be leading towards the type of washout price action where real bottoms can be formed. This is the chart of the past 12+ hours of trading:
Notice how, as I was writing the paragraph about how we didnt see a capitulation bottom yesterday, the market dropped suddenly. It fell over 400 dollars (roughly 10%) in less than 30 minutes and the period also featured a significant amount of arbitrage opportunity (22.7%). Perhaps most important, however, is what took place as I quickly used the CoinRoutes software to look at the consolidated order book as that bottom was being reached.
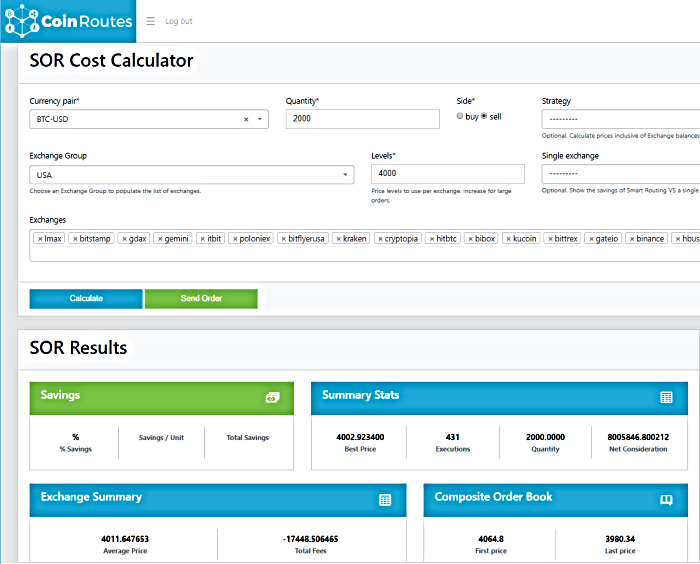
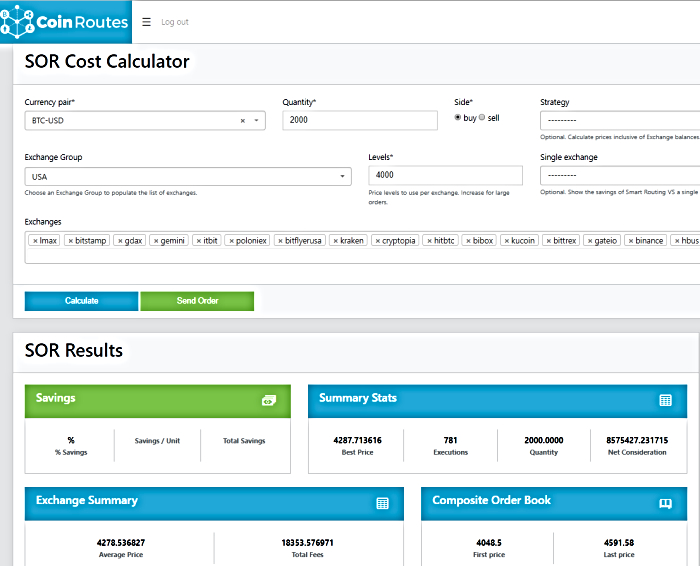
I used the CoinRoutes Cost Calculator to see where I could sell 2000 Bitcoin as it approached the bottom and I simultaneously asked the system where I could buy 2000 Bitcoin. The results were very surprising: The cost of buying the coins was over TRIPLE the cost of selling coins, which is a strong indication that the bottom, at least for the short term, was in. Sure enough, the market jumped over 150 dollars after this in a short period of time.
This is the results for the hypothetical Sell order of 2000 Bitcoin at the bottom, which shows that 2000 Bitcoin could have been sold at a price of 4002.92 including fees, while the best bid was 4064.8:
This is the results of the hypothetical Buy order of 2000 Bitcoin at the bottom where the coins would have cost 4287.71 inclusive of fees when the best offer was 4048.5:
Perhaps more important for traders, however, is that the subsequent rally appears to have been led by this exchange market liquidity. While I was running the preceding scenarios, I was also watching Bitmex, where the price continued to fall for several minutes after seeing the unbalanced order book. This will likely surprise many professional traders, who think that the futures markets always lead the spot Bitcoin markets. It is, however, clear that exchange liquidity is very important in the Bitcoin ecosystem and it shows the need for a full depth, consolidated book data feed such as available from CoinRoutes for traders…
(For those who are curious, here is the same chart as above, with another 20 minutes of trading tacked on. I am not going to declare that we have seen THE bottom, but it certainly was A bottom, and one that our clients were able to see…)