


(FLASH FRIDAY is a weekly content series looking at the past, present and future of capital markets trading and technology. FLASH FRIDAY is sponsored by Instinet, a Nomura company.)
How will ‘liberation day’ – April 2, 2025, the day US President Donald Trump imposed significant tariffs on imported goods – go down in history as a financial-market event?
In the very short term, it was cataclysmic. The benchmark S&P 500 equity index plunged 12% in a matter of days, as the Cboe Volatility Index (VIX) surged from 22 to 52. Government bond yields fell while corporate bond spreads widened, all on concerns about a protracted trade war that would reduce economic growth and boost inflation
It was all-hands-on-deck for exchanges, brokers, trading platforms, wealth managers, and most any other financial-market professional. At the Fixed Income Leaders Summit this week in Washington, DC, one speaker likened the workplace on liberation day to the first 10 minutes of Saving Private Ryan.
But two-plus months later, it’s as if liberation day never happened, at least as per the top-line market gauges — the S&P 500 has recouped its losses, VIX is quiet again, and the 10-year US Treasury bond yield is back to where it was in March. This all happened as President Trump has delayed tariffs and reached some limited agreements with US trading partners.
While there remain pockets of volatility in spread products and elevated long-term yields, for now it seems like markets have gotten past liberation day, suggesting the episode is more likely to be a blip in the historical record, rather than the start of a protracted bear market.
Oft-cited comps for liberation day as a market event are comparatively recent pullbacks such as the start of the COVID pandemic in early 2020, and the global financial crisis of 2008-2009. JP Morgan Wealth Management published a much more extensive list of 21 drawdowns, dating back nearly a century to the Great Depression.
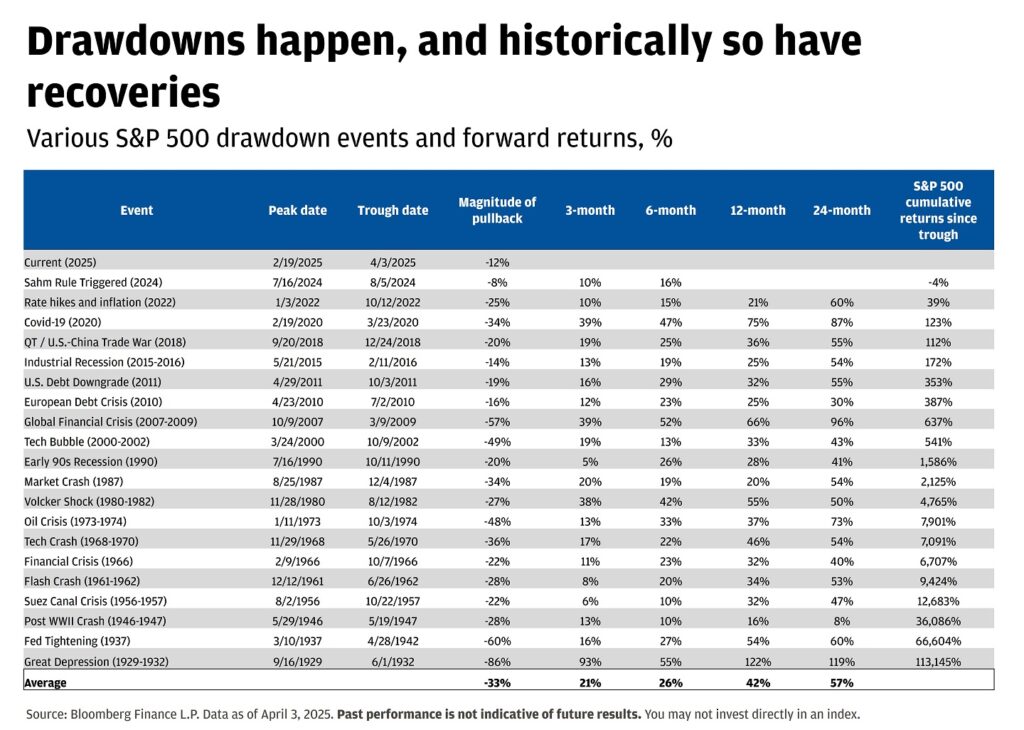
“Volatility is a normal feature of markets,” JP Morgan stated in an April 4 Insights post entitled Lessons from “Liberation Day”.
Aside from the chart’s obvious big kahuna, the magnitude of pullback, the most interesting measure might be the duration between peak date and trough date. While the ‘Liberation day’ and Covid downturns were remarkably short — about two weeks and five weeks, respectively — there have been some long ones that many of today’s market participants don’t even remember. The GFC market downturn was 17 months and the early 2000s tech bubble’s was more than two and a half years; even further back, the Volcker shock crimped markets for almost two years in the early 1980s, and Fed tightening touched off a five-year market malaise during World War II.
Add it all up and it seems that ‘liberation day’ has made it into the market-drawdown hall of fame, but only barely, as it doesn’t hold candle to many other crises. But that’s for the market historians to sort out — right now, market participants need to figure out what ‘liberation day 2.0’ might bring as soon as next month.