


The stellar growth of ETFs is something we have discussed before. However, in that study we actually found that ETF turnover is falling, resulting in a far more gradual increase in ETF value traded than previously expected.
Consequently, fears that ETF liquidity is supplanting or distorting stock liquidity is unfounded, as today’s charts show.
Stock trading liquidity has increased almost twice as much as ETFs
While it’s true that ICI data shows active portfolio turnover falling, it’s not true that notional stock liquidity in the U.S. market has fallen.
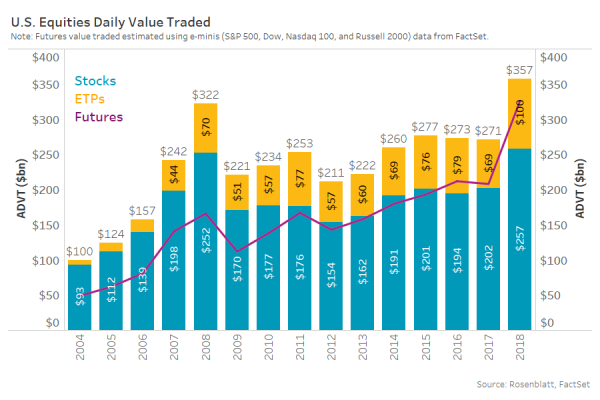
In fact, from 2004 through 2018 notional stock trading has increased 177%, equivalent to around $164 billion per day more liquidity. Over the same time U.S. market cap has increased 99%, so corporate stock turnover has actually increased.
During that same period ETF liquidity increased just $93 billion per day, much less than the gain in corporate stock liquidity. That’s despite ETF assets increasing 15-fold—or $3 trillion—over the same period. That means ETF turnover is actually falling, as newer buyers of ETFs are, on average, longer-term holders.
Chart 1: Growth in average daily notional liquidity across stocks, ETFs and Futures
How much does ETF liquidity affect stock demand?
It is also true that ETFs, over most of the past decade, have remained steady at 25% of all stock-market liquidity. But that doesn’t mean each ETF trade results in a stock trade, for a few reasons.
- Not all ETFs represent U.S. stocks. In fact bond ETFs are now around 25% of all ETF assets (around $1 trillion) and offshore Equity ETF AUM adds another $736 billion. Combined, that’s 40% of all ETF assets.
- Most of the time ETF spreads are cheaper than underlying stocks, making stock-arbitrage unprofitable.
- ETF creations and redemptions, can be used to estimate underlying stock trades. They add to just over 6% of all ETF buying and selling and less than 3% of all stock buying and selling.
Let’s look at what the data show.
ETF spreads are so tight many trades don’t trigger stock arbitrage
Some claim each ETF buy creates a wave of stock buying, and each ETF sell creates a wave of stock selling. But data from a KCG report (ETFs Rarely Enter the Arb Zone, 2014) showed that’s highly unlikely.
That’s mostly because ETFs trade with much tighter spreads than the underlying stocks in their portfolios, as Chart 2 shows. Given that ETFs also trade very close to net asset value (NAV) intraday, it is rare that an ETF will trade rich enough for the ETF bid to be at a premium to the portfolio offer (or vice-versa for ETF selling), which is required for stock arbitrage to be profitable. In fact, Chart 2 shows most ETFs would need to trade multiple ticks rich or cheap to trigger stock arbitrage.
Instead, there is evidence of a natural ETF-to-ETF trading ecosystem that provide liquidity to ETF traders by transferring risk across other ETF assets, at (spread and settlement) costs much lower than the cost of trading in underlying stocks.
Chart 2: ETF spreads are mostly much tighter than underlying stock spreads

Based on this, it would seem the net effect on supply and demand for a specific stock due to ETF trading should be small.
Creations and redemptions are less than 3% of underlying stock trading
One way to look at this is to measure creation and redemption activity. That’s because it’s not unreasonable to assume that most creations result from buying underlying securities and converting them to ETFs. Meanwhile, redemptions result from selling underlying shares and converting ETFs into stock to offset the short stock position.
If that’s the case, creations and redemptions are a reasonable approximation of how much ETFs add to underlying securities trading.
According to Credit Suisse, ETF creations plus redemptions are running around $2.8 trillion per year. Although that’s a huge number, it needs to be put into perspective (see Chart 3).
Mostly it reflects just how liquid the U.S. market is. In fact we estimate that:
- Total buying plus selling of ETFs adds up to about $46 trillion per year, more than 10 times the level of creations and redemptions. Another way to interpret that to say that nine out of 10 ETF trades are ETF-to-ETF, and don’t lead to a creation, and therefore don’t affect stocks at all.
- More importantly, total buying and selling of corporate stocks is a whopping $118 trillion per year. ETF creations are just under 3% of that liquidity.
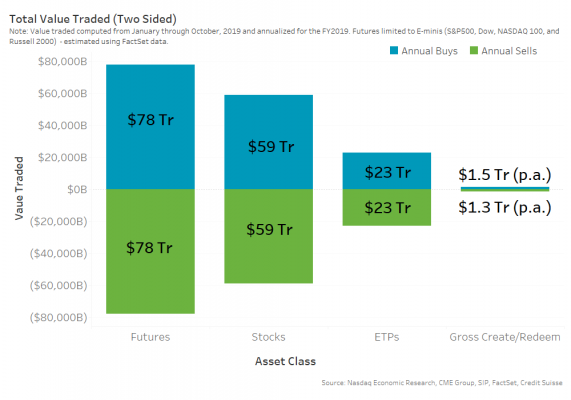
But that’s not the whole story. ETFs, as we all know, represent underlying bonds, international stocks, commodities and U.S. stocks. Only creations in the U.S. stock ETFs should lead to U.S. stock trades. According to Credit Suisse, that totals to just $1.5 trillion in creation and redemptions for the year. That’s just 1.3% of underlying stock trading.
Futures buying and selling adds $156 trillion per year
Although these are all really big numbers, the biggest source of equity liquidity each day is often left entirely out of this debate.
As of 2019, we estimate that equity futures trade around $310 billion per day. That adds to buying and selling of around $156 trillion per year, mostly in S&P500 exposure. That’s roughly equal to stocks and ETFs combined.
Chart 3: Two-sided liquidity each day in equities across exchange traded instruments
ETFs aren’t as big a risk to the market as many claim
The data show that although notional values around ETF assets and liquidity are huge, they aren’t so huge when put in perspective. Stock and futures trading still dominates net equity markets.
In reality ETFs are getting more and more like the mutual fund complex:
- ETFs represent over 2,000 different exposures, including bonds, international equities, commodities and “smart beta” portfolios.
- As a group, they represent diversified holdings and the growth of smart beta and active ETFs makes them more and more like mutual funds.
- They are held by all sorts of investors, from retail to hedge funds. And as ETFs mature we’ve also seen new buyers are in general longer-term holders.
It easy to say ETFs are eating stock liquidity and impacting price discovery. But the data just doesn’t support it.
