


We recently discussed all therouting choicesan algorithm has to make to place an order into the market-picking the right price, time, order type, venue, and order aggression. Today we focus on just one aspect of those choices: the venues the router can send orders to. Let’s bust a few myths at the same time.
The U.S. market trades over 7 billion shares a day, adding up to about $70 trillion in notional value each year. But most of the volume trades away from the primary exchange chosen by each issuer, and more than one-third trades off-exchange, on an ATS.

Chart 1: The distribution of liquidity in the US market
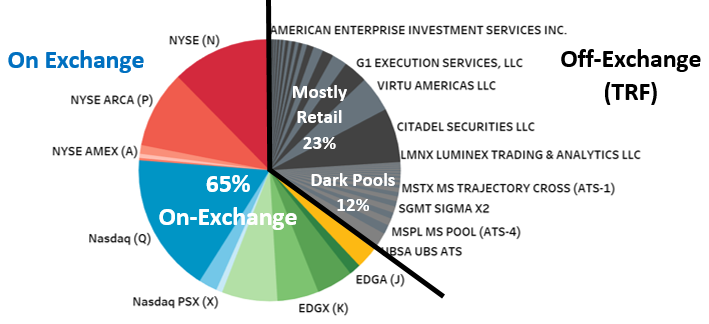
Source: Nasdaq Economic Research, SIP data, FINRA ATS data (for Oct-Nov 2018)
Three different flow interaction models
Exchanges are regulated under theSecurities Exchange Act of 1934. One of the founding principles of exchange operation is they must offer fair and equal access to all participants. Exchanges also tend to be the only venues with published lit quotes that advertise liquidity for everyone to see and trade.
Those lit quotes are important to the whole market. Despite all the different exchange venues, the SIP (Securities Information Processor) combines all quotes and provides an NBBO (National Best Bid and Offer). The NBBO allows everyone to know the best bid and offer regardless of what venue they are posted on, all less than a millisecond (one-thousandth of a second) after the quotes change. No other industry can claim to have the same, market-wide, fair and equal pricing for their customers.
More than one third of trading is off-exchange
Off-exchange volume adds to more than one third of all the liquidity in U.S. markets. Thats more than 2 billion shares a day. However it isnot all dark pools, as we discuss below.
Its rare for an off-exchange venue to contributequotesto the NBBO, but all thetradesdone still need to report to the SIP for everyone to see. Because these trades are coming from broker dealers directly, they need to first pass through an official Trade Report Facility (TRF).
TRF trades dont disclose the venue that handles each trade, but recent reporting enhancements (see Where did this data come from? below) require brokers to report aggregated trading to FINRA on a two-week lag. Using this data we are able to see the breakdown of the TRF in more detail-and we see that:
- Just one-third of off-exchange is Dark Pools (ATSs)
This is one of the common myths of Equity markets. In fact the 30-plus dark pools combined make up around12% of ADV, and just overone third of the TRF.
Some may realize this number is lower than what Rosenblatt reports. Thats because their view of dark pools is not the same as ATSs-as they include institutional ping pools and exclude retail ATSs.
- Much of the rest is Retail
The rest of the TRF is other trades brokers match before they reach the exchange-often on a principal basis. That includes large block trades and other risk facilitation trades-like ETF RFQs and MOC guarantees. However we can see from the reporting the majority of these trades are done by wholesalers, or Market Makers who work directly with retail brokerages. Prints from wholesale maker makers (Citadel, Virtu, G1x, 2-Sigma and UBS) represent around11% of all ADV, and almost anotherone third of the TRFvolumes.
- All are protected from bad fills by lit markets and the SIP
Importantly for investors-even though trades on the TRF do not reach an exchange, they are all protected by the prices that exchanges show.
- NMSRule 611requires all off-exchange trades occur at prices no worse than the NBBO available – at the same time – on exchanges.
- NMSRule 605requires public disclosure of just how good the execution quality was each month.
Every industry segment uses incentives
The U.S. equity market is extremely competitive. Each segment of the market has devised a number of economic incentives to attract order flow to their venues. Rebates were targeted by the recently announcedAccess Fee Pilot, but they are just one of the many different incentives used across the industry.
Some of the common incentives are listed in Table 1 below.
Table 1: Different incentives in the U.S. market
|
What |
Who |
How |
|
Payment for Order Flow (PFOF) |
Retail |
Retail flow is generally smaller trades. That makes them less toxic, meaning a market maker who fills retail trades captures more spread than if traded against larger traders in other venues. Consequently, wholesalers sometimes pay retail brokers to attract flow. Typically they execute these to capture the spread and avoid transaction fees. In a competitive market Retail Brokers may use these payments to benefit investors via subsidized settlement, or to provide tools and resources. |
|
Price Improvement |
Retail & bilateral venues |
An alternative to PFOF is to pass the lower toxicity directly to the retail investor via price improvement – giving them a better price than the NBBO at the time. This is why many retail trades have an average trade price that is 4 decimals long-even though NMSrule 612requires orders be routed in whole cents. Institutional investors can also establish direct lines with market makers-and receive price or size improvement. This is also how Systematic Internalizers (SIs) work in Europe. However market makers can decline, or pass through to exchanges, trades they deem as unprofitable. That allows them to offer different liquidity depending on how informed an investor is-arguably giving better investors better fills. |
|
Discounts |
Exchanges and Brokers |
Discounts are used in many industries, especially when fixed costs are much higher than marginal costs. This is done by allowing large customers to reduce their average cost to trade. Examples of exchange discounts include smaller or even negative margins on trading and bulk discounts on colocation and ports. Brokers tend to offer more competitive commission rates or subsidize sponsored access-sometimes to give them scale to hit exchange discount levels. |
|
Tiers |
Dark Pools (ATSs) |
One of the key marketing benefits of Dark Pools is their ability to segment customers. That segmentation is designed to reduce information leakage and adverse selection. Consequently, fill rates and execution quality will vary for each customer. |
|
Rebates |
Exchanges |
Exchanges use rebates to encourage lit quotes into the market. Weve recently discussed how maker taker rebates aregood for market qualityand even benefits off-exchange traders. The SEC recently proposed apilot banning rebates. |
Where did this data come from?
The U.S. market is among the most transparent market in the world-and recent regulatory changes have increased transparency. However not all data comes from the same place. The data for the market share we collected above comes various sources with different delays and aggregation levels:
Exchange market share: can be extracted directly from theSIP data. Each trade is flagged with the venue of execution, allowing us to aggregate market share by venue and ticker and day, in real time.
TRF trades:are also available on the SIP. However they are only flagged by the TRF operator posting the trades to the SIP (Nasdaq-TRF or NYSE-TRF), not the broker or ATS executing the trade.
Dark pools (ATS) market share: Can be extracted fromFINRAs ATSpage. However this data is disclosed in aggregate, and with a delay (2 weeks for liquid stocks and 4 weeks for Tier 2 or thinly traded stocks)
Other TRF market share: Can be extracted fromFINRAs non-ATSpage. This data is also disclosed in aggregate, and with the same delay as ATS data. If you want, you can also parse the download to see this market share down by broker and ticker-although many firms will qualify as De-Minimis at this level of granularity.
More from Economic Research
The views and opinions expressed herein are the views and opinions of the author and do not necessarily reflect those of Nasdaq, Inc.