


It’s difficult in a market like this to watch your 401k account shrink. To stop the flood of bad news, some have even suggested the markets should close until after the coronavirus uncertainty is over.
But is that a good idea?
There are not many data points to support this, as it hasn’t happened very often. But markets have indeed closed intentionally for multiple days, even if just a handful of times.
When we look at the data, the closures rarely reduced volatility or even stopped markets falling. But risks seem aplenty.
Chart 1: Markets have rarely run away from volatility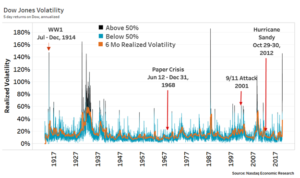
The data above shows that multi-day closures are rare (red arrows), despite many episodes of volatility spiking above 50% (black tipped bars). In fact, markets have historically stayed open through high levels of uncertainty, providing liquidity and price discovery. Please note that while the Paperwork Crisis lasted for six months, markets closed for one day per week during that time.
History says intentional multi-day market closures don’t stop selloffs
There are only four multi-day U.S. market closures over the last 100+ years. That’s despite the fact that there have been many more bear markets and volatility spikes (Chart 1).
Turns out most market closures were accompanied by operational issues, with important participants physically unable to get all aspects of the market infrastructure working.
Data also show that generally, the more operational the stoppage was, the smaller the impact on volatility.
However, the multi-day stoppages that were accompanied by significant uncertainty and volatility saw those markets re-open, on average, down an additional 6% (Chart 2) with volatility roughly doubled (Chart 3):
- World War I: The longest closure was back in 1914, when the market closed for more than four months at the start of WWI. Ironically, after closing that long, the U.S. was still years from joining the war when markets reopened.
Markets were closed shortly after the declaration of war and a rapid 11% selloff. When they re-opened months later they immediately dropped a further 21% and volatility tripled.
Chart 2: Halting markets does not stop them falling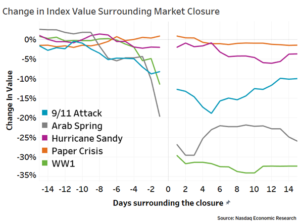
- 1968 Paperwork Crisis: In 1968 all trades were manual, entered on paper tickets, and processed onto paper stock certificates which themselves had to be physically delivered to brokers and their customers. Volumes had increased rapidly to 21 million shares per day, which caused a paperwork crisis and more than 100 brokers reportedly failed. To help alleviate the backlog of bookings and settlements, the market decided to close for one day each week for the six-month period.
These intentional shutdowns didn’t affect volatility. In fact they happened during one of the lowest volatility decades in the past century (yellow in Chart 1).
Chart 3: Volatility typically increases after a multiday closure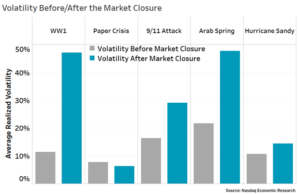
- 2011: Arab Spring: During the Arab spring, with protests that preceded the overthrow of Egyptian president Hosni Mubarak, the Egyptian market plunged. In the weeks before the closure the market had fallen 20% and realized volatility spiked to around 80%. The Egyptian stock market was closed for eight weeks while the political situation and protests calmed.
When the market re-opened, stocks fell another 10% and volatility spiked even higher, above 100%.
- September 11 attacks: The U.S. terrorist attacks in 2001 caused the collapse of the Twin Towers and shutdown much of downtown Manhattan for months, causing the loss of lives and offices of many in the industry. Despite that, the market opened four trading days later. By that time the scale of the damage, and of the government’s fiscal and monetary response, was much clearer. The fact that no additional similar attacks were recorded also helped calm traders.
The market dropped 5% on reopen and sold off 12% at its lowest point shortly after September 11, which was less than many had feared just days before. But volatility more than doubled. One month after the attacks, the S&P500 was back at its level from September 10.
- 2012: Hurricane Sandy: Sandy battered Manhattan and Hoboken, New Jersey, flooding the offices of market makers and index providers, and New Jersey oil storage. It caused a large blackout that affected much of downtown Manhattan, including the offices of NYSE, Nasdaq and many brokers. Road and subway tunnels were also flooded making it harder to get into New York City, especially from New Jersey. Despite many critics, the market shut down for two days while infrastructure was returned to normal. The market re-opened mostly unchanged, although volatility was slightly elevated.
What are the unintended consequences?
Just because a market is falling doesn’t mean valuations are irrational. As we recently discussed, there is a strong likelihood that company earnings will be lower this year. If that’s true, valuations and stock prices should be lower too.
Efficient and transparent market prices are also useful to investors and regulators. As a contrast, consider the unusual price movements in bond markets last week, where bonds were selling off in lockstep with stocks, and bond ETFs were trading at discounts to less liquid corporate and muni bond indexes.
Price discovery also helps efficiently allocate assets, especially in times of stress. For example, current markets show the most significant loss of revenues are likely in the travel industry and energy stocks, while health care and technology are seeing increased demand (Chart 4). That helps the government focus their policies and understand changes in personal behaviors.
Chart 4: Live markets result in more efficient prices and can help regulators see the impact of policies and allocate resources better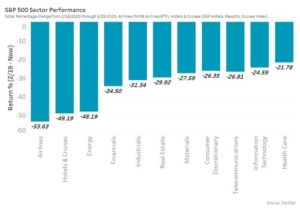
Perhaps most important of all, a closed market doesn’t mean investors’ portfolios are worth more. It just means their portfolio is illiquid and valuations are stale.
In fact, Chart 2 shows that investors who are forced to wait for liquidity usually reopen at even lower prices later. That’s bad for anyone that needs liquidity now, whether to pay for rent or school, or to buy even cheaper stocks or bonds.
Ironically, the person it doesn’t impact is most 401k investors, who have no intention of trading and can afford to wait this selloff out, whether the market is continuous or not.
Markets also exist for corporates to raise capital. Even in the current crisis, companies involved in COVID-19 research or hospital supplies may need extra capital. Getting it quickly will help fight the virus and get the economy back to normal. In addition, the public will benefit from live prices if the government decides to buy equity in a company needing a bailout.
The bigger unintended consequences come from failing to understand that efficient markets are interconnected. An ecosystem of participants that include hedge funds and market makers keep the interrelationships of assets around the world priced efficiently—U.S. stocks vs. European stocks, U.S. stocks vs. futures, even U.S. stocks vs. bonds and FX rates and each other.
Closing something as large and interconnected as the U.S. equity market would not only break those interrelationships, it would squeeze liquidity in unexpected ways and generate losses that could not be covered:
- U.S. Retail investors would be forced to sell less liquid U.S. Corporate bond and Muni bond markets in order to access cash.
- Institutions would be forced to fund equity redemptions using other less liquid equity markets (Chart 4), or futures, as pensions, retirement plans and the like will still need to be funded.
- But futures and options market makers wouldn’t be able to hedge with underlying stocks, meaning institutional trades may pay more for the liquidity risk or get worse prices.
- If other asset classes sell off (or rallied) while U.S. markets were closed, they would create profit and loss where previously perfect hedges existed. And the margin calls to arise from these losses could not be met by selling U.S. stocks and deleveraging positions.
- Even if futures and options markets closed in sync with stock markets, the expiry dates on derivatives would create one-sided exposures on hedges that could not be closed out, and delivery obligations when no valuation or settlement is available on the underlying assets.
Because of this, the threat of closing the markets itself could be enough to trigger its own liquidity crisis.
Chart 5: If the U.S. equity market closed, it would shift selling pressure to smaller markets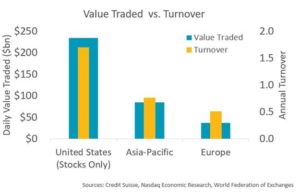
There is already enough uncertainty in the market. The worst thing we could do now is add more uncertainty by changing rules, breaking hedges and squeezing liquidity into less liquid markets.
In times like this, we need all participants trading and hedging with confidence in the future. That’s why markets have rarely stopped for a selloff.