


The SEC’s new NMS II proposals seem to lack an overarching philosophy of how markets work best.
On the one hand, they want to reduce duplicative costs and create a more “free market” solution to data distribution that speeds up the Best Bid and Offer (BBO).
On the other hand, they want to increase government controls over even more market data. Something that will, ironically, slow the Securities Information Processors (SIPs) back down and duplicate fixed costs.
It also goes against the current view that the SIP should only be for data the industry is mandated to buy. But instead of expanding the regulated data to protect investors more, the new rules reduce many of the protections investors currently get from lit quotes.
Table 1: How regulated data works now vs. under NMS II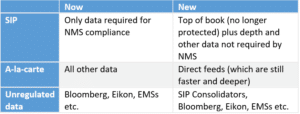
Source: Nasdaq Economic Research
Depth is available now
It’s important to note that this isn’t about suddenly making markets more transparent. The data we are talking about is already available. In fact, Bloomberg and many trader desktop systems already aggregate quote feeds and distribute depth data to customers on the buy and sell side. So most sophisticated traders can see depth now.
Including depth it in core data may increase the regulatory obligation to subscribe to depth. Given there are around 100-times more SIP subscribers than direct feed customers, this may actually increase industry costs. That would be unfortunate for many, as the data below shows, as it might not make much difference to their trading.
More regulated data, fewer protections
When NMS was created, the concept of “protected best quotes” was a core principle of the rules. Protecting the best price (top of book) ensured everyone was much more equal than before. Retail investors and sophisticated hedge funds all had the same protections and prices.
Because all investors needed to know and respect the National Best Bid and Offer (NBBO), across all venues, the SIP was created to compile and disseminate those protected prices. The opposite to how bond markets work.
In contrast, the government now plans to significantly expand their reach to include depth data in the SIP, even though they are simultaneously unprotecting a lot of the National Best Bid and Offer (NBBO).
How much do traders really use depth quotes?
If more people might be obliged to purchase “core depth” data, a big question is: Who really needs it?
We know from how retail mostly trade (with wholesalers) that they mostly don’t even hit the protected quote. So while depth might look good on their screens, it’s irrelevant.
Almost all of the rest of the market trades electronically, so only the algos really need to see the actual depth before they direct oversized orders through protected quotes. In fact, when we look at how often quotes that are not protected (depth) actually trades, the data appears to show that:
- Market-wide, around 1.5% of all volume is executed outside the NBBO, on an Intermarket Sweep Order (ISO) sweep that takes out the quote plus additional levels of depth.
- More than half of that actually happens off-exchange, adding to almost 92 million shares per day (blue bar), so it doesn’t actually trade through exchange depth.
- That leaves around 0.7% of volume that hits exchange depth. Have we mentioned before these changes are designed for the most sophisticated 1% of traders?
Not surprisingly, on-exchange depth lifted is skewed to the listing venues with the most quotes (and not surprisingly, rebates for liquidity providers). Once the new SIP committee gets established, quote depth should be a factor in determining the reallocation of new SIP depth revenues back to depth producers.
Chart 1: Trading through is less than 1% of all trading on-exchange
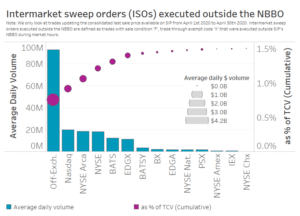
Source: Nasdaq Economic Research
But before you get too stressed about how much these “trade throughs” cost your mutual fund, it’s worth also looking at how many levels of depth are usually traded through.
The most common answer is “one.” In fact, data in Chart 2 shows 74% of the 1.5% of volume that trades through are for three levels or less (85% for stocks under $100 per share). Even then, remember that a three-cent sweep gets fills at one and two cents too, so the weighted average cost of all those sweeps is closer to 1.3 cents from the far touch. We estimate that those trades are around 0.06% more expensive than the quote, with the benefit being they are filled faster, for a larger size than the quote.
Chart 2: Data shows ISO sweeps typically trade through one or two levels of the book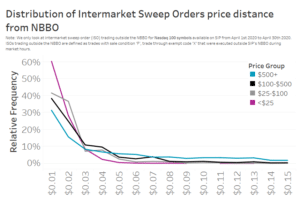
Source: Nasdaq Economic Research
Interestingly, although the high priced stocks look “less deep,” the problem is the decimal scale. A one-cent difference in a $500 stock is worth just 0.2 basis points (bps), much less than spreads on the most liquid stocks. Consequently, there are many “air-pockets” within their quotes. That also means the “second level” might be four cents at one time and 10 cents at another. That’s yet another reason why intelligent ticks are a smart idea.
How much does depth help traders?
Another way to look at this is whether the depth helps you understand your picture of the market.
Information about the net skew of the book (to buy or sell) is useful to traders. In Chart 3 we look at how frequently five different states of the book occur over time:
- Neutral represents a book that is +/-20% around net flat, so shares to buy (sell) are 1.5 times or less the quantity of shares to sell (buy).
- Instances where one side of the book is between 1.5 and 3 times (skew 20%-60%) the other are labelled as either buy or sell.
- Strong buy (and sell) is a book with three times or more the shares to buy (or sell) versus shares on the offer (or bid).
When we look at the net buy or sell imbalance at the NBBO (top of book, horizontal axis), we find it is similar to the shape of the depth of book 69% of the time (Chart 3: grey in the neutral + green in the buy + red in the sell etc.). We’d highlight that even when the top of book is “net to buy or sell” the depth actually goes back to neutral 15% of the time, making the data a weak trading signal 84% of the time.
It’s likely that there is information in the other 16% of data for a back-tested algorithm, but for most humans looking at a screen, the additional directional information is far less useful.
Chart 3: Data shows depth affects the net buy/sell information just 10% of the time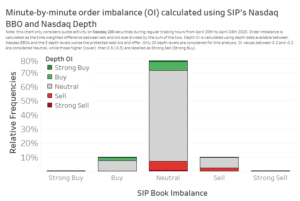
Source: Nasdaq Economic Research
V is for Volume
Another thing depth data can help with is knowing when larger blocks of liquidity are available just below the NBBO. What does the data show?
We’ve shown before how supply and demand for stocks evolves in a V-shaped pattern. Not surprisingly, when we apply the new round-lot rules and analyze depth, we find that’s still true. In fact, the cumulative depth increases in a fairly linear way. Although this looks at large cap (Nasdaq-100) stocks, we do see:
- A “hump” on the sub-$25 per share stocks indicating that some traders place passive orders away from the NBBO before the quote actually gets to those prices for queue priority.
- Supply and demand curves for high priced stocks looks flatter, but that’s because their high prices mean 15-cents of depth represents far less economic change (mostly less than 2bps). We’d note that’s another distortion intelligent ticks would reduce.
Chart 4: Data shows the top of book usually has the most volume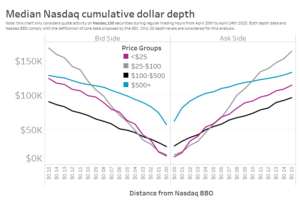
Source: Nasdaq Economic Research
Clearly for an algorithm, with a systematic approach to quoting, and back-tested results, there may be useful information deeper in the book. But (again) algorithms already get that through their richer (and still faster) direct feeds.
Which brings us to another consideration: Speed.
Does the SEC want to speed the SIP up or slow it down?
A whole lot of the changes we discussed earlier show the SEC was determined to speed the SIPs up.
But adding depth to the SIP will undoubtedly slow it down. That’s because we estimate the SIPs will need to process as much as 11x more data.
Right now the SIP collects the single best bid and offer (price and quantity) from each exchange and puts together the NBBO.
The new rules are complex. They create:
- A (smaller) odd-lot problem, where odd lots are (still) not included in the SIP.
- Variable round lots which become the BBO.
- All depth levels with (new) round-lots between the BBO and the PBBO would also be reported.
- A protected PBBO at the first 100 shares.
- Five more levels of depth after that.
Looking at Chart 5, currently all the SIP reports is the yellow circle. That same price is used for retail best ex, quote protection, public display and off-exchange execution price matching. Simple and consistent.
In the future, our data indicates the new BBO (blue circle) will be different to the PBBO (pink circle) for many groups of securities. Depth (purple) will also be reported to 50bps for low price stocks but far less for many liquid, higher priced stocks. Finally, we highlight that based on our book data, odd lots (grey circles) will likely still improve the quote for stocks between $50 and $1,000.
Chart 5: How we estimate the NBBO (SIP now) will compare to PBBOs, odd BBOs, new BBOs and depth across stock price buckets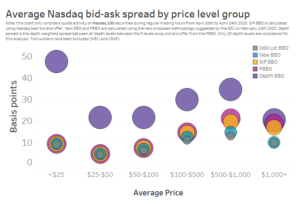
Source: Nasdaq Economic Research
But what this new structure really does is creates a lot more message traffic for the SIP to process. That’s because:
- There are more than five times as many levels to report.
- As well as all the levels between the BBO and PBBO.
- Plus, every time any level of depth updates, the SIP will update, too.
In fact, we estimate that the new SIP with depth will contain around 11x as much data as the old NBBO.
Chart 6: Our estimation of the change in SIP message traffic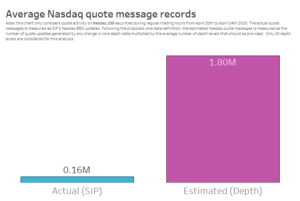
Source: Nasdaq Economic Research
As new exchanges join the quote, so too does the message traffic to process and the costs of consolidating the additional data.
It’s mostly common sense that adding more data to the SIP will slow it down. But we can also look at data from the current SIPs to learn how this might work. Sure the new consolidators could throw more hardware at the problem, but at the end of the day, data shows that larger bursts of traffic take longer to process (this is all relative):
- SIPs already publish trades and quotes at different speeds. It’s likely that depth would be a “separate” feed only to those who want to buy it, and it would undoubtedly be slower than the top-of-book feed.
- Even though the SIPs are fast, they are not always the same speed. Just like anything else, when it gets busy, bottlenecks form. The data in Chart 7 shows that when there is a spike in volume, the processors take materially longer to process messages (purple circles).
- Importantly, our recent post highlighted that the busiest times are also when the most volume is trading.
Chart 7: Data shows even the SIP processing is slower in busy times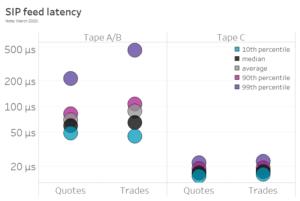
Source: Nasdaq Economic Research
Will investors still miss the big picture?
Despite all this effort, data shows that most of the best prices in the market today will still not be publicly available. In fact, off-exchange and hidden orders already make up over 50% of all trading, with more than 19% of all liquidity in the U.S. is being price improved off-exchange versus the same “inside” quotes the current NBBO protects.
Adding depth to the tape actually doesn’t do much to improve investors’ prices.
Chart 8: Over 50% of trading is off-exchange and 99% is protected by the SIP we already have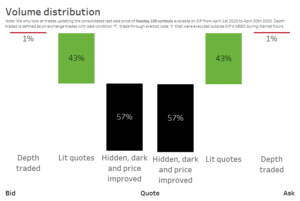
Source: Nasdaq Economic Research
Data shows depth in the SIP helps the 1% of investors who might need exchange depth, even then it represents less than 1% of trades. We suspect most of them already have depth data and faster direct feeds (that are both already regulated by the SEC).
Meanwhile none of these changes are designed to benefit issuers, who care most about deep liquidity at tight spreads and deep and stable closing auctions and make up 100% of the tickers investors trade. Nor are the 99% of less sophisticated investors that sometimes need the SECs protections helped much by this complexity. For them the SIP is plenty fast enough and has more than enough depth for their needs. Data shows the SIP NBBO costs just a fraction of the price improvement that it helps create. A net cost-benefit for retail investors.
The more we think about these proposals, the more they look like a complex solution in need of a problem.
The views represented in this commentary are those of its author and do not reflect the opinion of Traders Magazine, Markets Media Group or its staff. Traders Magazine welcomes reader feedback on this column and on all issues relevant to the institutional trading community.

