


On March 3, 2020, the Federal Reserve announced its first emergency rate cut since the Financial Crisis in order to combat mounting Coronavirus fears. This rate trimming of 50 basis points from 1.75% was intended to calm markets and reduce business uncertainty. The rare nature of such actions provides valuable information regarding the current economic backdrop.
The equity market typically rallies on rate cuts, since investors have easier access to liquidity. It also reinforces the notion of a Fed’s protective put- or the idea that the Central Bank will intervene as necessary in order to stabilize financial markets. The protective put serves as a damper on volatility, by reducing uncertainty through lax monetary policy. These policy decisions primarily occur during the scheduled meetings of the Federal Open Market Committee (FOMC).
Figure 1 provides a history of emergency rate cuts, along with the following cumulative returns of the S&P 500 (SPX) over the next month.
Figure 1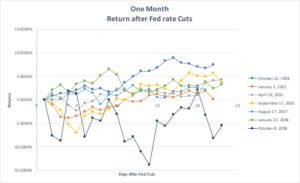
Source: OptionMetrics
In six out of seven cases following a rate cut, the index finished higher or at an even level. This chart provides evidence that these meetings do provide short term fuel for asset prices. Figure 2 demonstrates that post rate cuts, the level of the VIX moves to more stable levels, which shows that this monetary shift does provide some uncertainty resolution.
Figure 2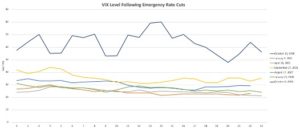
Source: OptionMetrics
However, if returns are analyzed over the following year, the results are for the strong bear case. Figure 3 plots the cumulative yearly performance following emergency meetings, which provide far less optimism. The biggest losers are the holding periods following the intermeeting cuts in January 2001, April 2001, September 2001, August 2007, and January 2008. Losses during these times range from -9.7% to -35%.
Figure 3 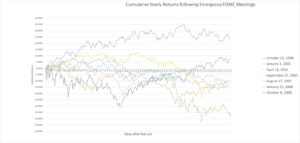
Source: OptionMetrics
The clear outlier can be credited to the Greenspan cut in October 1998. This cut was in response to Russia’s financial crisis and the turbulence surrounding the failure of Long-Term Capital Management. However, we should be cautious in taking such an exception as a sign of hope. This announcement was the coming out party for Greenspan Put; and for the first-time investors began pricing perpetual government insurance into asset prices.
The other exception is the October 2008 emergency meeting, which was the beginning of the Fed’s zero interest rate policy. While equities did provide a positive yearly return after this meeting, any investor would have still taken the brunt of a 30% drawdown.
Granted, this analysis suffers overlapping returns due to the clustering nature of meetings and a small sample overall. However, the very nature of intermeeting cuts implies that the board is responding to extreme downside risks present in the real economy. This is acknowledged in official statements. The simple fact is that a monetary action occurred outside of a regular meeting in an attempt to get out ahead of inevitable negative economic news.
The yield curve provides an economic context for understanding subsequent equity returns. Figure 4 plots the 10Y – 2Y Treasury Spread with emergency cuts in red.
Figure 4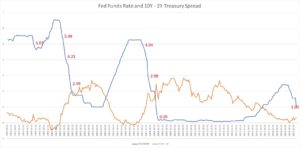
Source: FRED
With the exception of October 1998, intermeeting cuts are followed by bull steepening regimes, or an environment where rates are falling but the yield curve is becoming steeper. This is triggered by investor expectations that the fed will have to continue to trim rates in response, as more negative economic news begins to trickle out. Bull steepener situations are, therefore, closely linked to poor equity performance. This is troublesome, given that the current yield spread is continuing to rise even as the 10-year falls lower than 1%.
Rate cuts are designed to propel markets in the short-term. However, history is not on the side of longer-term equity performance following unexpected Fed news. Weak fundamentals, typically, are likely to be reflected in a steepening yield curve, as investors expect the Fed to continue to slash rates.
Garrett DeSimone, PhD, is Head of Quantitative Research at OptionMetrics, an options database and analytics provider for institutional and retail investors, and academic researchers.

