


By Phil Mackintosh, Nasdaq Chief Economist
Failure-to-Deliver (FTD) occurs when one party fails to uphold their end of a trade by not delivering their shares (or cash) by the settlement date, currently two days after the trade (T+2).
We’ve talked recently about how Reg SHO rules require short sellers to locate (although not physically pre-borrow) stock in advance of their short sale so they are able to settle their short trades. But even long investors can fail trades if there is a problem with account allocations and booking trades through to custodian accounts.
Which made us wonder: Just how many trades fail?
Most symbols have failed trades
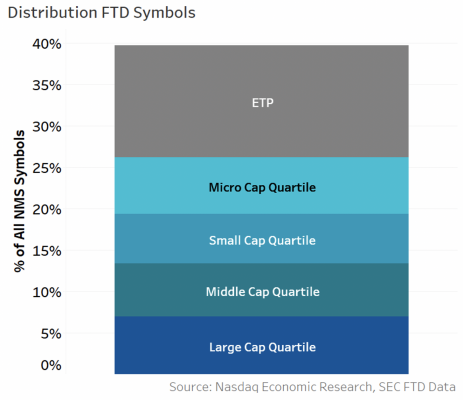
Surprisingly, data from the SEC shows that 40% of all tickers had shares that failed to deliver each day (Chart 1).
Our research shows that fails are distributed very equally across market cap. We allocated all NMS corporate stocks to quartiles based on their market cap, putting around 1,500 stocks in each basket. Then we looked at how many stocks in each quartile were on the fail list. The blue quartiles in Chart 1 are very equal, although large cap and microcap fail at a slightly higher rate than stocks in between.
There are well over 2,000 ETFs in the NMS universe now too, making that bucket larger than the corporate quintiles. But the fact that ETFs are more than double any of the stock quintiles seems to show ETFs fail more frequently.
Chart 1: 40% of all tickers have shares that failed to deliver on an average day in 2020
It’s not as bad as it looks
Close to half of all symbols feels like a lot. But a deeper dive into the data puts this into perspective.
Importantly, failed trades are a relatively small portion of overall trading.
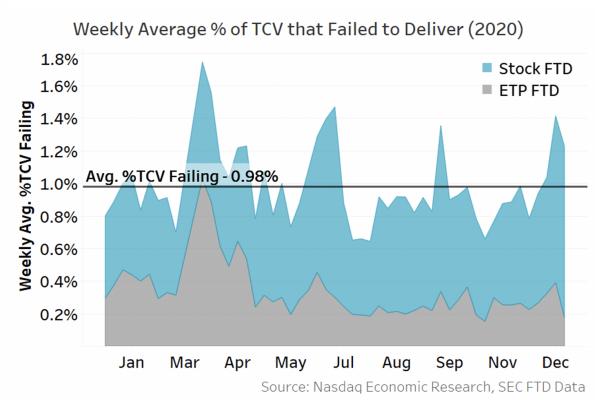
Looking at the total failing shares, the overall market-wide failing shares add to less than 1% of market-wide traded volume on an average day (Chart 2). The data also show that level was reasonably constant throughout the whole of 2020, although it did rise last March as COVID-19 shutdowns started and a few hedge funds closed down. It then fell below average during the strong rally that included many new retail investors.
Chart 2: Failing shares make up a small portion of the overall market, less than 2% of total consolidated volume
If we look deeper, we also see that’s because the shares that are failing for most tickers are very small.
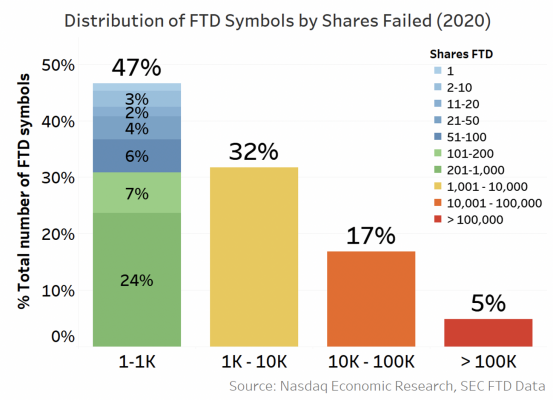
Almost half of all failing tickers are failing on less than 1,000 shares, many for less than 100 shares (blue colors in Chart 2). In fact, 79% of all failing tickers were for under 10,000 shares, which, although an operational pain, doesn’t seem to pose systemic risks.
Of the remaining stocks with fails, only 5% of failing tickers (so 2% of all tickers) fail for more than 100,000 shares (Chart 3).
Chart 3: A majority of symbols have relatively immaterial quantity of shares that fail
While half of all symbols fail on any specific day, the total shares failed is a small portion of the overall market volume. Most fails are concentrated in just a few symbols.
Which raises another question.
What sort of tickers fail?
One thing that seems to lead to elevated fails is high levels of short selling.
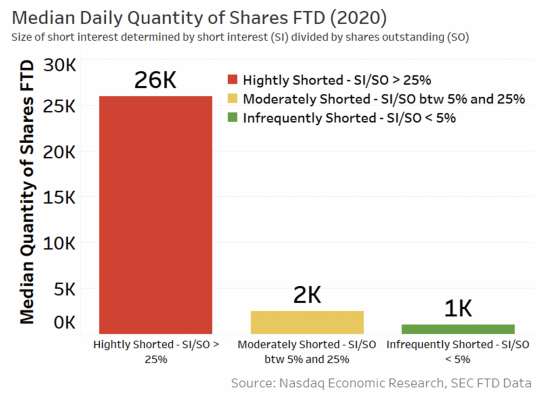
We saw a while ago that very few tickers have short interest over 25% of shares outstanding (SI/SO). However, when those companies fail to settle, they typically fail for much larger quantities (and often for more consecutive days too). Those symbols have a median failure quantity of 26,000 shares, compared to 2,000 and 1,000 failed shares for stocks that are moderately or infrequently shorted, respectively (Chart 4).
Chart 4: Symbols with strong short interest are more likely to fail for larger size
Do stocks or ETFs or stocks fail more?
In addition to the stock locate rules, there are “buy-in” rules for traders that fail for a number of days.
From the data, we can see several tickers that fail for more than five days in a row during 2020. However, we don’t know if it’s the same person failing to deliver or a series of different trades.
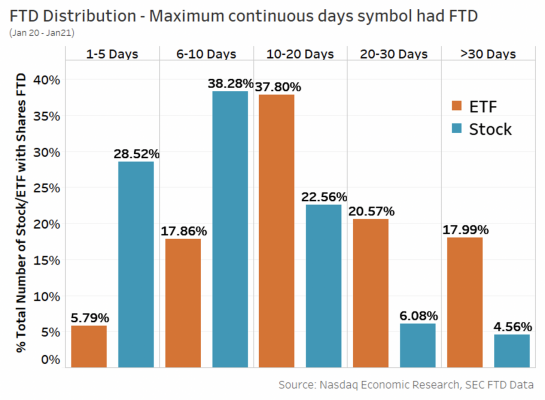
What we find is that ETFs tend to fail for more days each year and also more continuous days per year. However that’s likely because the time it takes liquidity providers to build baskets and complete creations to receive ETF shares for settlement can be more complicated.
Chart 5: ETFs tend to fail more, but not necessarily continuously or by the same person
What does this all mean?
Overall, shares that fail to deliver are a relatively small portion of the overall market.
Although most stocks appear on the fail list frequently, it’s mostly for small quantities of shares, and may be due to technical or processing errors.
The few symbols that have a substantial quantity of shares that fail make up most of the failure volume on a given day. But usually, those tickers don’t persist as fails for long, thanks to buy-in rules.
In short, although fails happen a lot, they are mostly very small and mostly short-lived. They don’t seem to pose a systemic risk—just as the rules intend.

