


How much value does a buy side trader add to the investment process? According to Bloomberg Tradebooks survey at the 2016 Asia Trader Forum, more than half of the respondents (56%) evaluate trader performance using the classic TCA vs benchmark prices. However, this simple benchmarking method does not properly represent the risk that a trader is taking to achieve the return. One popular evaluation alternative is to compare the Sharpe ratios – the average performance divided by the standard deviation. However, an inefficiency of the Sharpe ratio calculation is that it does not account for order profiling, meaning a trader may appear to perform better simply because he is in an easy market. A buy side trader should be rewarded, however, by how he performs relative to the difficulty of the orders. Thus, we have identified three components that are important to evaluate execution performance:
- Performance measure
- Risk measure
- Order profiling
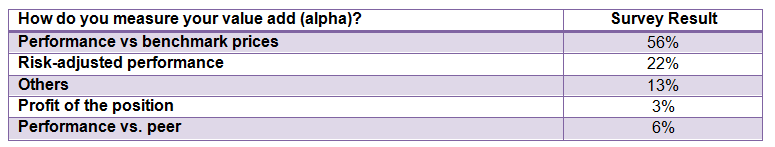
Table 1. Asia Trader Forum 2016 poll survey
We propose a new approach to combine the three criteria in a united framework (Figure 1). This approach is a parallel analogy to the Capital Asset Pricing Model (CAPM) that is commonly used to evaluate investment alpha. First, we select a benchmark and calculate performance of each order as standard TCA. Then we set a so-called index strategy and evaluate its performance for each order. We will discuss more details on the index strategy below. Finally, we run a regression on the order performance vs the index performance and obtain alpha and beta. Alpha will be the net value added after risk adjustment, and beta is a measure of risk with respect to the index strategy.
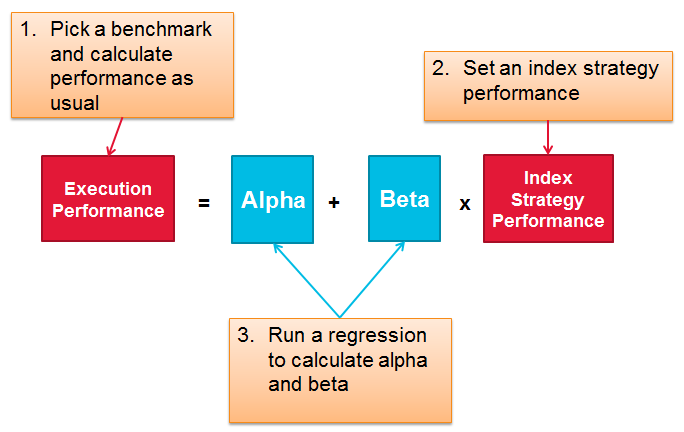
Figure 1. A risk-adjusted alpha-beta framework to evaluate execution performance.
In this article, we calculate the index strategy performance as the peer average (Figure 2). For each of our own trades, we consider peer orders with a similar order profile in the last 30 days. Then the index performance is calculated as the average in the peer group. Figure 3 illustrates the time series of the peer average together with individual orders. The idea of this approach is to reward traders who outperform in a tough market, and penalize those who underperform in an easy market.
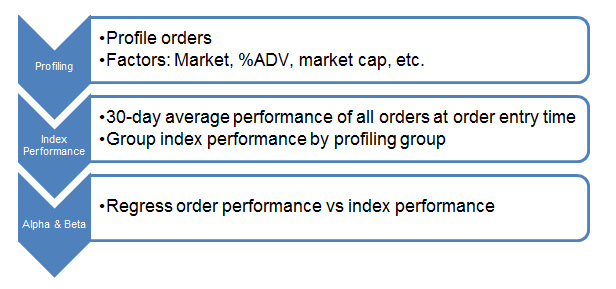
Figure 2. Index strategy as peer average
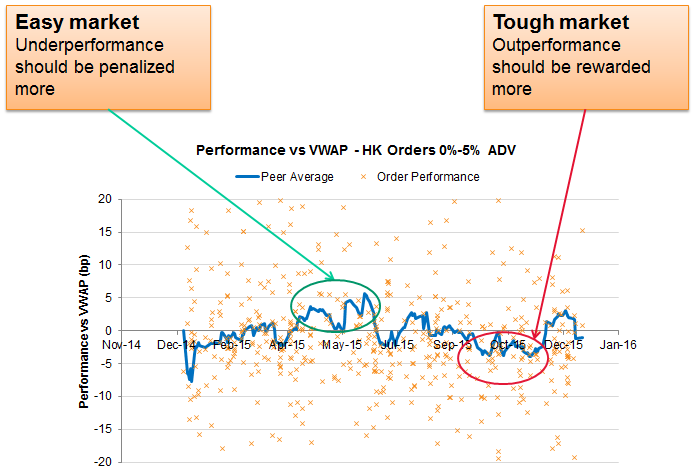
Figure 3. Relative performance vs. peer averages
Table 2 shows the results by running the alpha-beta model on Hong Kong orders in 2015. After the risk adjustment, B-Smart, a dynamic liquidity seeking strategy, provides the best performance. B-Smart also takes the most risk across the strategies. On the other hand, VWAP strategy gives the lowest alpha and almost zero beta. This suggests that a static VWAP strategy is not taking much risk but does not add much value either.
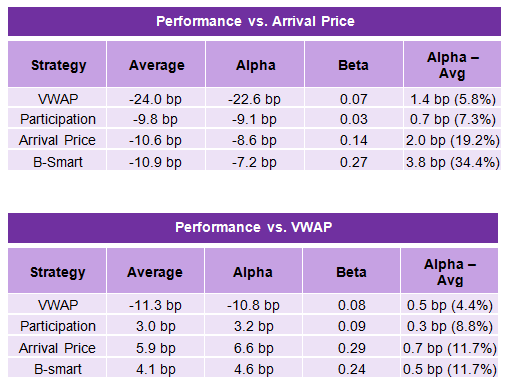
Table 2. Risk-adjusted performance vs Arrival Price and VWAP. Average = simple average performance in the sample period. Alpha = risk-adjusted performance. Beta = sensitivity to the peer performance.
In our framework, alpha represents the net value added by a buy side trader. It does not generally equal the classic performance measure vs a benchmark, but only in special cases. One example is when accessing unique liquidity or using a unique strategy. In this case, the correlation to the peer performance is low and the overall performance will become 100% alpha. The skill of a buyside trader to outperform others by accessing unique liquidity with a unique strategy will be reflected via alpha on a risk-adjusted basis. This is analogous to the alpha that fund managers deliver by outperforming the index.
Performance, risk and order profiling are the essential elements to evaluate execution performance. The proposing alpha-beta approach is a unified framework to account for the three elements at the same time. While buy side traders are equipped with different trading strategies and exposed to different market conditions, the new approach attempts to provide a consistent evaluation method across buy side traders and desks.