


This article was written by Brad Foster, Bloomberg’s Global Head of Enterprise Data Content and Zane Van Dusen, Liquidity Product Manager.
Despite the old adage that the next financial crisis won’t look like the last one, for the past decade, financial practitioners have been fixated on building their own ‘Lehman scenarios’. Over the years, that scenario has become increasingly obsolete, and the recent disruption caused by the global COVID-19 outbreak provides a real-world example of why that is the case. As expected, the current stress is unlike anything we have seen before, and this is why it is important to shift the focus from historical scenarios to those based on changing market conditions.
What happened this time?
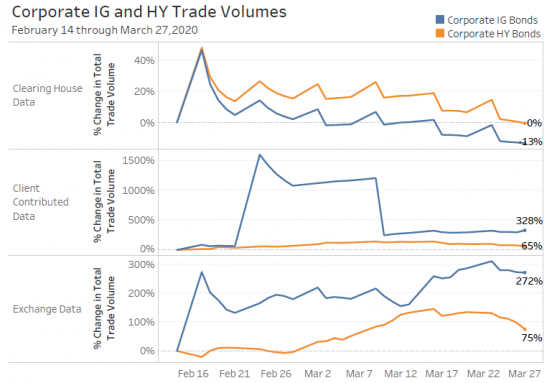
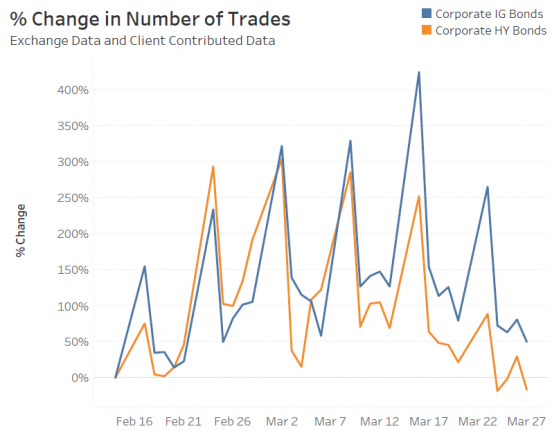
By analyzing the fixed income trade data feeding Bloomberg’s Liquidity Assessment solution (LQA), which includes data from TRACE, clearing houses and client contributed data flows, we can see how liquidity was impacted by the global COVID-19 outbreak. While many traders noted that liquidity had evaporated, the data shows that trading volumes (both in terms of total trading volume, and number of trades) were relatively stable through the end of March, and actually increased on some of the most turbulent days. This is in contrast to 2008, where we can see that trade volumes reported to TRACE reduced by 50-70%.
If trade volumes increased, then why were traders feeling a liquidity crunch? The answer: trade costs. While traders were able to execute similar (or higher) volumes during this volatile period, the data shows that they only could do so at a cost roughly 5-20x larger than they could prior to the global outbreak, depending on the sector/issuer. However, unlike in 2008, the financial sector was not bearing the brunt of this stress – other sectors especially those related to travel and leisure were hit hardest due to the increasing number of travel concerns and restrictions. Effects were also felt in the energy sector due to the oil price war between Saudi Arabia and Russia that was simultaneously playing out.
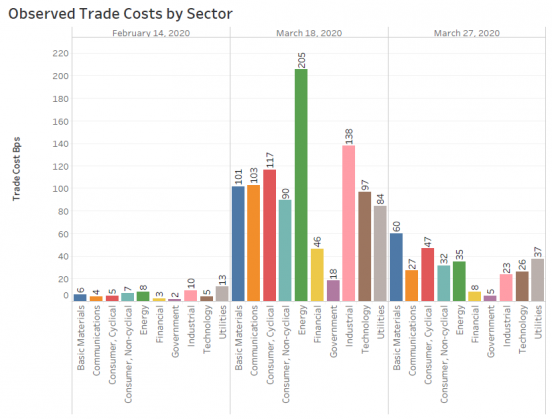
Bloomberg’s LQA solution incorporates the above data into its regular model calibrations, and both reacted to and reflected the changing market conditions. We tested this by running LQA on the constituents of the Bloomberg Barclay’s Global Aggregate Index to predict the cost over a 1-day liquidation horizon, and confirmed that the LQA data aligns with the trends we noted in the trade data: significant increases in trade costs across sectors, in particular energy and travel.
The views represented in this commentary are those of its author and do not reflect the opinion of Traders Magazine, Markets Media Group or its staff. Traders Magazine welcomes reader feedback on this column and on all issues relevant to the institutional trading community.