


In most of the world, the majority of trading costs are charged in basis points (hundredths of a percent), which means variable costs are the same for a $1 million trade in any stock.
However, the U.S. has stuck to cents per share and mils (cents per hundred shares). With the rapid changes in stock prices, thats creating some interesting distortions, as todays charts show.
What are the typical trading costs?
There are a number of separate, explicit costs of trading that we consider in todays post.
- Spreads are the difference between the best bid and offer in the market. Investors often cross the spread for an immediate fill. Even with algorithms to fill work orders, data from the tick pilot shows it costs more to trade stocks with wider spreads.
- Commissions are a cost that almost all investors have to pay. Although many retail firms charge a fixed $4.95 for a trade, most institutional investors pay cents-per-share rate. According to Greenwich Associates, the average rate for algorithmic trades in 2017 was 0.9 cents-per-share or 90 mils, while the average high-touch rate was 3.8 cents-per-share.
- Maker taker fees are a hot topic right now, with the SECs proposed access fee pilot designed to focus specifically on these charges. We would highlight that these charges, as well as all other exchange costs, are bundled into commission rates.
- All-in costs to trade on an exchange, which include net maker and taker fees discussed above, are also bundled into commissions. However, given the debate about trading costs, including claims they have a disproportionate impact on…investing, it is interesting to put these in perspective.
- SEC fees are also charged to all investors when they sell stocks. Rather than bundle these into trading or commission costs, these are passed to the customer on their contract notes; these are actually charged based on the value traded (so are a constant % of value).
There are many less transparent costs we dont consider here, from the fixed costs of custody and settlement to the variable costs of market impact. Both are a topic for another day.
In cents-per-share, low-priced stocks look cheaper to trade
Given cents-per-share is the U.S. convention, lets first look at trading costs that way. We compare costs across different buckets of stock price as that also reflects increasing value traded (per share):
Chart 1: Costs in cents per share are fixed as stock prices rise, while basis point charges increase to be consistent with the higher value being traded

Obviously, costs in cents per share are constant across many measures. However, Chart 1 shows that spreads and SEC fees vary as price increases:
- Note that 100mils = one cent. Its clear the low priced stocks trade mostly one cent wide. However high priced stocks trade closer to $1 wide (as 10,000 mils = 100 cents).
- To fit spreads on the chart, we use a log scale on the vertical axis. That means each step is 10-times the cost of the prior step. So in fact, algorithm costs at 90 mils are triple the maximum take fee of 30 mils, which is just over triple the all-in exchange costs of around 8 mils.
- All-in exchange costs are the lowest for stocks with prices above $20.
- Take fees, are higher than all-in costs on an exchange because most algorithms capture some rebates too; the net make-take is included in the all-in-exchange costs.
- Although commissions are higher, remember that they bundle all-in exchange costs, including net make-take fees, as well as other broker services and technology costs.
- SEC fees increase as value increases, which means they rise as stock price increases. Amazingly, for stocks priced above round $1,800, SEC fees exceed even high touch commissions.
- Spreads, as we have noted before, change significantly depending on a stock market cap, stock price and liquidity, as well as volatility. For many stocks, especially for high priced stocks, they are the largest explicit cost of trading. This chart also shows that rebates are a decreasingly important incentive as stock prices rise.
Overall, looking at charts in cents-per-share makes it look like low priced stocks are generally cheaper to trade. However, that result is misleading, as we see below.
In percentage terms, low-priced stocks are expensive to trade
Investments earn returns in percentages, so Chart 2 is a more appropriate way to look at the costs of trading and how much each cost impacts trading returns. The most important thing this chart highlights is that most trading costs are pretty insignificant for an investor holding stocks for the long term, especially for stocks priced above $20 per share.
Looking at costs in percentages (or basis points, which are hundredths of a percent) shows that, thanks to each cent being a greater proportion of the total (smaller) share price, low-priced stocks are actually the most expensive to trade.
Chart 2: Costs in cents per share decline as stock prices rise
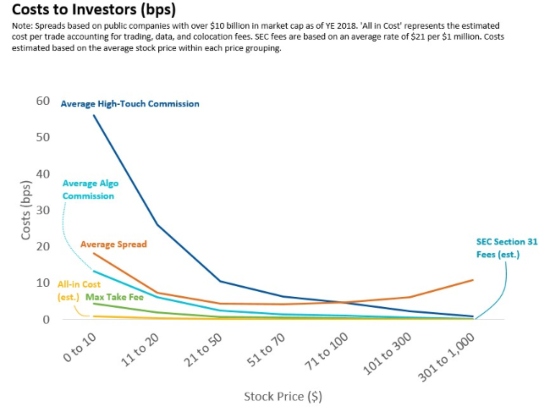
We also point out that these costs are far from equal:
- Spreads are consistently one of the most significant costs we consider and, importantly, they chart a U-shape, increasing for stocks with prices that are both too low as well as too high.
- Commissions change materially across the range of stock prices. In fact, the commission earned on a $20 stock is roughly 100x larger than for the same value traded in AMZN or BKNG. However, the cost and consumption of research and trading is closer to the same. Based on this it appears that bundled commissions simplify the economics for buy-side clients, cross-subsidizing high priced stocks with higher commissions earned from low priced stocks, although that cross-subsidy is arguably an economic good.
- All-in exchange costs and SEC fees are not material costs to investors, as even in basis points, both of these costs rest pretty close to the axis across the spectrum of stock price.
Why is this important?
For most small investors, this level of detail really isnt important at all. Brokers bundle commissions and offer services competitively. The overall result is very low costs of trading.
Weve also shown how institutional traders trade at even lower cost, using dark pools, inverted venues and odd lots where spreads and costs are artificially high. Although in that sense, this data highlights again that our one size fits all rules dont work the same for all stocks.
But for market structure geeks, there is a policy takeaway too. The SEC has recently been focused on whether tiered pricing and cross-subsidies are fair and equitable. This short study would show not only are they common throughout the industry, but they often lead to better financial results for investors.
As Europe has found, unbundling has unintended consequences that arent always good for the whole market. In the U.S., focusing on one cost at a time runs the risk of missing how market economics really work. If we fully unbundled trading, why should issuers pay for all the cost of listing when we all benefit? Without market-wide incentive programs, how would exchanges incentivize tight spreads and liquidity across thinly traded stocks that hold off-exchange trades accountable?
The data show that although trading economics are sometimes distorted by penny ticks, the market has mostly bundled and tiered charges so incentives are spread appropriately.