


The short answer to this question is: It depends!
The longer answer is different for different investors and trading signals. That, in turn, means issues like long queues, invested venues and speed bumps matter more (or less) depending on how you need to trade.
Trading is a trade-off
We’ve talked before about how trading is a trade-off.
- Trade too fast, and you increase your costs, which reduces the investment returns you capture.
- Trade too slow, and you may miss liquidity at good prices only to see stock prices move away from your entry price. That also reduces returns.
But solving this problem for specific investors, while mathematically complex, is intuitively simple. What each investor needs to do is minimize their market impact, risk and missed alpha, and do it collectively.
Market Impact: Larger trades cost more
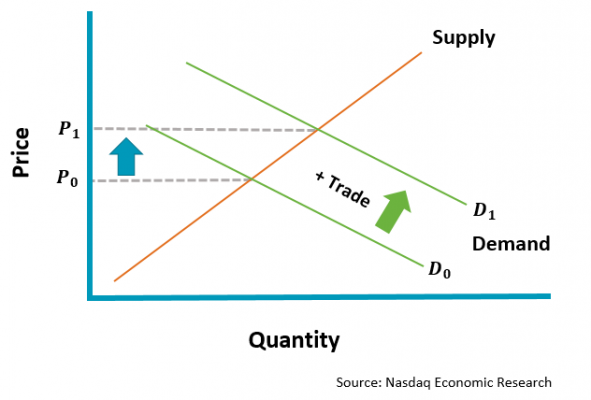
Market impact refers to how much your new trade moves prices.
At a fundamental level, this is supply-and-demand economics. If you demand more liquidity, you will impact the short-term supply and demand for a stock, which increases the average price you need to pay.
Chart 1: New trades change supply and demand, resulting in price moves (known as market impact)
There is plenty of established literature about the fact that trading causes market impact, with a Transaction Cost Analysis (TCA) industry that has developed to measure and manage it.
Most research shows that costs increase as size, volatility and spreads increase. That’s consistent with ITG data showing that average large-cap shortfall costs in the U.S. are around 30 basis points (bps) per trade while small-cap stocks with wider spreads and higher volatility cost about 80 bps per trade.
Most models usually define trade “size” as a percentage of average daily volume (ADV). This methodology makes sense when you see that turnover is pretty constant across all stocks. It also has the advantage of accounting for the relative size of each company. Clearly, buying $100 million of AMZN, with a market cap around $1 trillion, will be easier than buying the 50% of the shares outstanding in $200 million market cap stock.
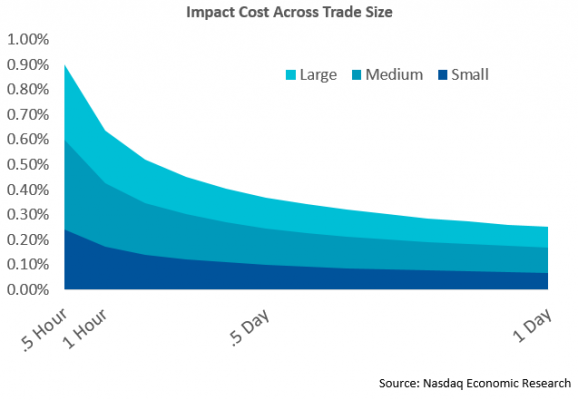
Research also indicates the costs increase at a decreasing rate. So doubling the size of a trade doesn’t double the price move required to finish the larger order. That makes sense when you consider that moving a stock price higher may itself attract sellers, helping offset later buying.
TCA data also suggests that trading the same order slower also reduces impact. That makes sense because trading slower allows sellers more time to organize offsetting trades. It hides your buy footprint better, too, as each buy order moves the supply and demand curves less (or allows the supply curve to be more elastic).
We show how impact cost might change for larger and smaller orders, as each is worked for a longer time in the blue areas of Chart 2.
Chart 2: Trade size and speed increase impact costs
Risk: Slower trades take more time to execute
However, trading slower is not without risks.
The problem with trading slower is it takes you longer to finish the trade. For example, if you wanted to trade 10% of a stocks ADV, you could:
- Trade it immediately in a block.
- Trade it in under an hour at a very aggressive participation rate (POV).
- Trade it in a couple of hours at around a 30% participation rate (POV).
- Trade it over the day at a 10% participation rate.
- Trade it over a week at a 2% participation rate (2% each day x 5 days = 10%).
Immediately trading a large block is usually expensive. With no time to find natural sellers, your large buying will typically cause more market impact.
Trading a very large trade in the market in under an hour will require you participating in more than half of all trades occurring. That will require crossing spreads and posting liquidity at new, higher levels to ensure priority over other buyers, pushing prices up.
However, if you spread the order out over five days, your trades become almost imperceptible against all the other noise and trading in the market.
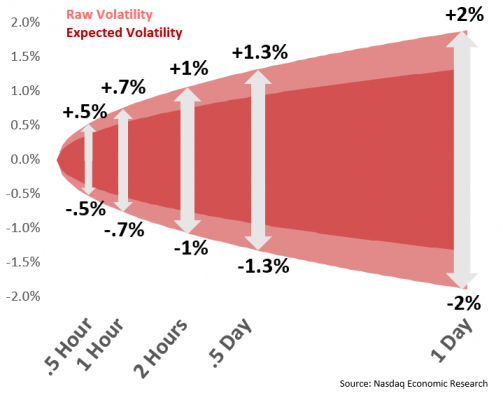
The problem with slowing an order down is that the chance that economic news or market sentiment changes is much greater over a longer time. Market risk increases as a root-function of time (Chart 3). Over the course of a day, a 30-vol stock is expected to move up or down 2% on average. That means, on roughly one-third of days, it moves even more than that.
Over a week, that risk increases to 5%, which could easily be more than your portfolio manager hopes to earn, resulting in missed opportunities and less portfolio outperformance.
Chart 3: Reducing speed reduces cost but increases risk
However, 1% of risk is not the same as 1% of cost.
The “expected costs” of risk are technically zero, as “random” market moves are just as likely to help as to hurt. Consequently, if you trade a lot, the costs of market risk will offset.
That said, because random price moves can result in unequal trade implementation, it makes sense to avoid taking unnecessary risk. Portfolio managers are used to scaling the risk down using a risk-aversion factor. In our optimization below we give 5% weight to avoid risk.
We’d also note that worked orders aren’t exposed to all the risk over the day. The trades done in the open are locked in minimizing risk on that portion of the trade. Only the trades at the end of the day see the full 2% expected risks. We show how working an order reduces risk with the darker red zone in Chart 3.
Alpha: can decay fast or slow
There is another, even more important reason to trade faster.
You might not be the only person with the same idea or the same new data. If that’s the case, if you go too slow, your competitors will be accumulating positions and impacting price, while you wait.
This is often called alpha decay or opportunity cost.
In theory, every trade should have alpha, or the expectation to outperform the market. If you don’t expect a stock you’re buying to go up, you’d be better off not trading at all.
The rate of alpha decay is what’s important to work out the optimal speed to trade.
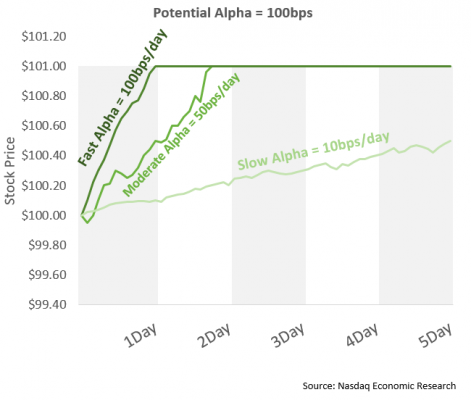
The most common way to estimate alpha decay is to watch what happens to stocks before, during and after a trade signal. In Chart 4 below we show three different examples of 1% alpha decay:
- The stock has momentum even before your trade signal, and quite quickly moves another 1% before performing in-line with the market, decaying at a rate of 50bps per day.
- The whole 100bps of expected alpha decays within one day, which can happen with known news events or data releases.
- A stock with much slower alpha decay of 10bps/day may occur for value stocks with no new news.
Chart 4: Alpha can vary by trading signal or strategy
In a perfect world, you would work this out before the portfolio was doing real trades. However, in the real world, you are usually already trading. That makes separating the alpha decay from the market impact more difficult. Although, it also means that your whole order isn’t exposed to an entire day’s decay (just like how early fills reduce risk).
One way to try to separate trading impact from alpha decay is to look at reversion. If you’re trading too fast, it’s likely the stock will fall back a little after your buying ends, while a stock with strong alpha decay may continue to rise after you complete your trade.
How fast should you trade: Putting it all together
Each of the metrics above changes based on the time taken to do the same sized trade. We can simply sum each of these factors to see how total costs (or expected shortfall) changes over different trading speeds. What we see is that typically a U-shape forms as Charts 5a and 5b show:
- Trade too quickly and trade costs overwhelm other benefits (blue area).
- Trade too slowly and missed alpha starts to impact your results.
- Even with weak alpha, exposing a trade to unnecessary risks isn’t optimal either.
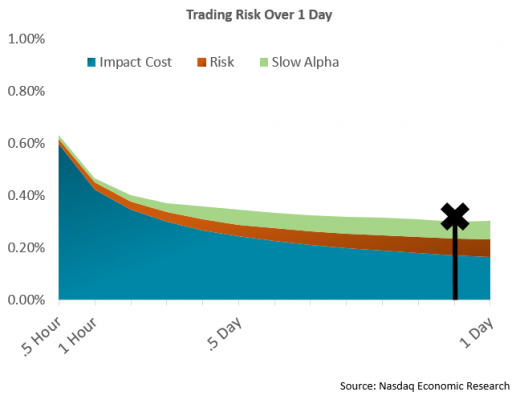
Conceptually, the right speed to trade is the speed where the shortfall (the sum of these costs) is the lowest. The low point of the U-shaped curve is marked in the chart below with the “X.”
These two examples also highlight how higher alpha decay should result in trading faster than the same trade with slower alpha decay.
Chart 5a: Trades with high alpha decay have a fast optimal trading speed
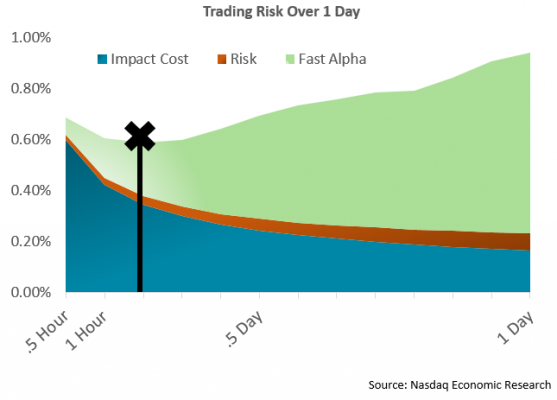
Chart 5b: Trades with smaller alpha decay have a slower optimal trading speed
Why is this important?
Minimizing trade costs will result in the highest possible returns in your portfolio. So it’s important to investors and a fundamental value of dedicated trade desks.
But this is also important to many of the policy debates occurring right now.
It means that the cost-benefit of the Access Fee Pilot would be different for different customers. In fact, for the very fastest traders, less broker conflict exists.
It’s also why inverted venues aren’t necessarily unfair. They allow fast traders to pay for queue priority while traders with a little less urgency have the opportunity to reduce their brokers’ trading costs and, ideally, their commissions.
But this is also important to the debate around speed bumps and hidden orders. Both incur opportunity costs, such as fading or missing some fills. That can be positive for slow alpha orders, as it should reduce trade costs over time. But for trades with higher alpha, that missed liquidity can be expensive. For the provider, avoiding “adverse selection” means missing fills on the near touch. For a taker, it means lower fulfillment while increases the costs of trading too.
As with most things in our market, the optimal solution is available, but it requires a trade-off between liquidity and cost, and a little math, to do it right.
