


NYSE’s Designated Market Makers (DMMs) are marketed as a way to intervene in trading, especially on volatile days, to absorb imbalances and to reduce volatility. Data shows that in reality, NYSE DMMs and floor brokers see the majority of dedicated order flow around the open and closing auctions, when liquidity of every stock is more concentrated on its home market. But the story sounds so plausible: A single human being, with control over all the information, should intuitively be better at reducing volatility. Right?
And given that, you would expect NYSE stocks to have lower volatility around the open and close auctions, especially in stressed markets. But do they?
March 2020 provided a stress test for markets
During March 2020, the markets sold off due to the COVID-19 pandemic. The spread of the virus was accompanied by social lockdowns and government rescue plans. All the associated uncertainty contributed to a consistently stressed market.
Data shows Nasdaq markets outperformed.
Auction price performance
Open price volatility is less for Nasdaq listings
We looked at how effective the opening auction price is by looking at how much prices change in the five minutes after the stock has opened.
The data from March 2020 shows that as markets were more stressed, price dislocations also increased. That makes sense, as there is a lot more uncertainty about the direction of markets and the correct valuations of stocks when a pandemic is changing consumer behaviors in ways never seen before, dramatically and quickly.
The data also shows that:
- Nasdaq’s open auctions saw better price discovery and less volatility in future prices throughout March – the most volatile month in 33 years.
- That’s also despite the fact that NYSE delays its auctions intentionally, sometimes for well over 15 minutes when volatility is high, allowing DMMs to reduce volatility by copying the price formation in other stocks.
- That was even true after March 23, when the NYSE reverted to electronic markets to protect floor staff.
- Interestingly, although the dislocations increased in that week the floor was closed, the gap between Nasdaq and NYSE narrowed slightly
That does not support the view that DMMs normally reduce volatility.
Chart 1: Opening Auction Price Dislocation Lower on Nasdaq in Stressed Markets

Source: Nasdaq Economic Research
How did we do this?
We start with S&P500 companies. That provides a more equal comparison, as small cap stocks trade very differently than large cap stocks.
We then compare the five-minute volume-weighted average price (VWAP) for each stock to the open auction price. The difference between the two we call the “auction price dislocation.”
We then compute a trade-weighted average (based on daily opening/closing auction dollar volume) for each ticker across the dates. Trade weighting ensures that the “costs” we calculate are closer to what investors experience, as they do more trading among the more liquid stocks.
Close price volatility is less for Nasdaq listings
We can look at close price volatility in the same way. Although in this instance we need to look at how much prices change in the five minutes before the stock closes.
Once again we use trade weighted S&P500 companies to ensure a reasonably comparable set of stocks. The data shows that Nasdaq stocks had:
- Slightly less volatility into the close, even while the floor was open.
- In the week when NYSE’s floor closed, trading also became easier and volatility into the close fell for all stocks. However, the data shows that Nasdaq increased its lead over the NYSE electronic closes during these stressed markets by over 3 basis points (bps) or 15%.
That might indicate that the single DMM model without an open floor puts investors at a significant disadvantage, when compared to the transparent and open Nasdaq closing auction process.
Chart 2: Nasdaq Close Price dislocations are lower in stressed markets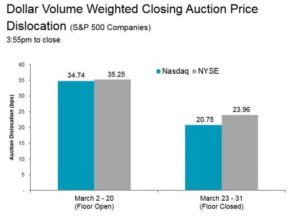

Source: Nasdaq Economic Research
This is consistent with academic studies
This result is really not surprising.
One big difference between the NYSE and Nasdaq closing auctions is a special order type (D Order) that can only be used by brokers on the floor. It allows the floor broker to enter or cancel large orders late in the day. That allows some investors to hide large orders from other investors, creating less reliable information about the liquidity required in the NYSE close.
In fact, one academic study found that even in normal markets: “The NYSE auction is therefore arguably less transparent and (less) competitive. We find that price deviations are consistently larger for NYSE than for Nasdaq auctions after controlling for stock characteristics”.
Spread Costs
There is not much point in having a compelling business model if your investors find it expensive to enter and exit their positions. That reduces their returns and may be enough to turn them away from taking a holding in the first place.
Spread costs are a major contributor to trading costs. Especially for investors who, with their one-sided trades, need to cross spreads more than market makers and arbitrageurs, in order to build positions effectively.
Consequently, lower spreads are important to lower trading costs.
There are a few factors that have a consistent effect on the pricing of spreads.
In previous research we found that the liquidity of each stock, measured as the value traded each day, is a key factor in how competitive, and therefore how tight, it seems spreads can get. Smaller cap stocks just don’t trade with spreads as tight as larger, more liquid stocks, other things being equal.
Another is volatility (or uncertainty). That means spreads tend to consistently increase at times when there is more uncertainty. We showed how increases in market-wide volatility generally leads to wider spreads. That’s because a bid and offer works like an option, where the spread is the premium, and the losses from being filled at the wrong price are theoretically unlimited. Finance theory shows that as volatility increases, so should the price of the option. For the same reason, at times of the day where uncertainty is higher, spreads tend to be wider. That’s also why spreads near the Open tend to be wider than around the Close. While in the morning there is a lot less confidence on the fair price of the stock, after a whole day of trading, price discovery is mostly complete.
Knowing this, we turn to what happened to trade weighted spreads in S&P500 stocks during the stress of March 2020.
Nasdaq spreads are tighter in the morning and the afternoon
When we look at spreads for NYSE and Nasdaq large cap stocks, data shows that spreads:
- Are higher around the open (chart 3) than the close (chart 4), as expected.
- Are much lower on Nasdaq around the open: 48% lower while the NYSE floor was open and 38% better after the NYSE floor was closed.
- Are also lower on Nasdaq ahead of the close: 13% lower while the floor was open, increasing to 25% better after the NYSE floor was closed.
Charts 3 & 4: Auction spreads are lower on Nasdaq in stressed markets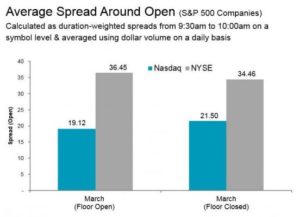
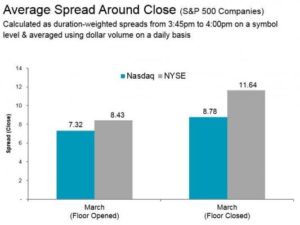
Source: Nasdaq Economic Research. Limited to S&P 500 Stocks.
Nasdaq spreads are tighter on average each day
If we look away from the times when the floor brokers are busy, and compare all-day spreads, we see the lower Nasdaq spreads persist. We also see that the gap increased as markets got more stressed, exactly when the human override is expected to have the most value.
Chart 5: Nasdaq spread advantage increased as market uncertainty increases

Source: Nasdaq Economic Research. Limited to S&P 500 Stocks.
At the widest in the middle of March 2020, Nasdaq large cap stock spreads were a full 5 bps or 25% cheaper than NYSE stocks. For the entire month, Nasdaq spreads averaged more than 4 bps better than NYSE. Given Nasdaq’s S&P500 stocks trade $124 billion each day, those crossing the spread saved 2 bps on every trade. That adds up to $25 million per day.
Nasdaq has more time at the best quote
This all raises the question: Why would Nasdaq spreads and volatility be better?
Nasdaq has a very different market model. We focus on providing incentives to as many market makers as possible, and encouraging them to compete fairly across a wide variety of stocks.
In contrast, NYSE confers special advantages to its single DMM and floor brokers. That puts other participants at a disadvantage, making them less inclined to compete for queue priority, which in turn can actually work against investors.
Data from March shows our approach results in a more competitive, higher quality quote. We are at the best bid and offer (the “inside quote”) more often for our S&P500 listings than NYSE is for its listings (Chart 6). Interestingly, after the floor closed, NYSE’s time at the inside fell from 36% to just 28% while our own recovered to above 50%.
Chart 6: Nasdaq spends the most time at the National Best Bid/Offer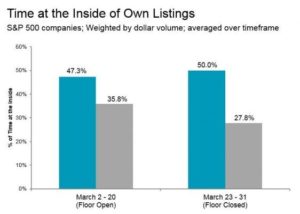

Source: Nasdaq Economic Research. Time at the inside weighted by dollar volume for S&P Stocks on respective listing market.
That’s consistent with other research we’ve done that shows Nasdaq is competitive with all exchanges, not just NYSE, in normal market conditions too.
Leading Market Share
One thing many people don’t realize is that U.S. stocks are allowed to trade on any of the trading venues in the market. It’s known as “Unlisted Trading Privileges” or UTP. Since that rule, Nasdaq-listed stocks must be allowed to trade on dark pools or any of the competing exchanges, regardless of the primary listing being with Nasdaq.
Since that rule, the market share of primary listings on the primary listing venues has fallen, as new exchanges and dark pools open to free-ride off the UTP rules. Today, nearly 40% trades occur off-exchange.
This competition ensures primary listing venues create rules to encourage good market quality on a stock’s home marketplace.
Data shows that during March 2020, Nasdaq listings trade around 34% of all liquidity on Nasdaq. That’s much higher than the 25% for NYSE listings trading on NYSE. In the last week of March, as volatility subsided, trading moved back to other venues. However, NYSE, with its floor closed, lost slightly more market share than Nasdaq (0.2 percentage points).
Chart 7: Nasdaq provides greater liquidity for our listed companies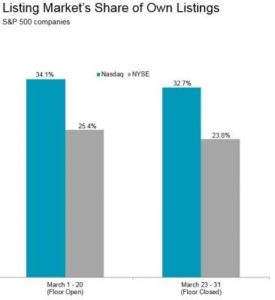

Source: Nasdaq Economic Research
Nasdaq Market Shines in Times of Stress
All this data shows that Nasdaq’s electronic market performs even better in high volatility, highly stressed periods. For S&P 500 stocks, we have better spreads, lower price volatility around auctions, and more market share on quotes and trades.
Contrary to claims, a human trader with a competitive advantage actually seems to make things worse for everyone else.