


By Phil Mackintosh, Chief Economist, Nasdaq
Something that not many people know is that high-priced stocks tend to have above-average options activity. Given recent reports of large options positions increasing volatility (or at least momentum) in tech stocks, we thought we’d take a look at what the data shows.
This also gives us the chance to take a look at whether AAPL and TSLA’s stock splits saw improved tradability as other research predicts.
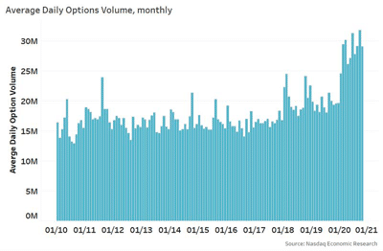
Options trading is at record levels
With volatility and uncertainty elevated thanks to the U.S. election and COVID-19, options markets have seen record levels of trading in 2020.
Chart 1: Options activity has increased in 2020
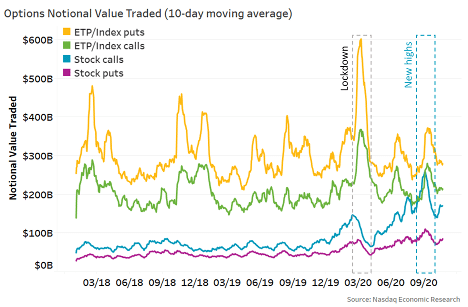
Data suggests that during the Coronavirus selloff in March, investors unwound single stock options positions but increased market-based (index and ETF) options significantly.
However, once the volatility subsided and the recovery commenced, that reversed. The longer-term trend of increased single stock options trading recommenced, with far more interest in calls than puts. And that trading peaked just as the market reached new all-time highs.
Chart 2: Single stock call trading has been rising more than market-based options
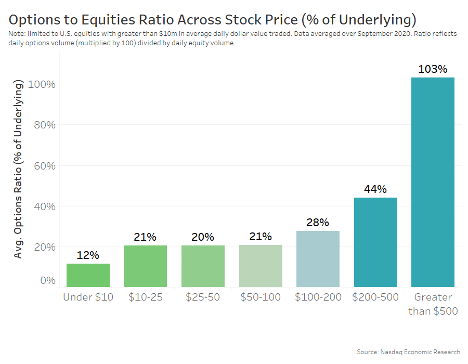
High priced stocks tend to have the most options activity
Interestingly, single stock options data also shows that the higher a stock price, the more options activity that stock has. In fact, for stocks over $500 per share, options trade more volume than underlying stocks, with the average representing 103% of the underlying volume.
Chart 3: Higher stock prices have more relative options activity
Data from retail brokers indicates that some of the increase came from retail investors. Options on high-priced stocks might be attractive for retail investors as a way to diversify. How? Consider the average retail trade is around $10,000, a round lot in a $1,000 stock costs $100,000 or 10 times the average trade size. In contrast, a 50-delta option on that stocks costs around half as much, leaving more capital for investing in other stocks and broadening a portfolio.
Although, we highlight that there have also been reports of large single stock institutional positions taken by SoftBank.
Options trading focused on high-priced stocks may add to volatility
Either way, long call positions create a “gamma hedge” for market makers. As the price of the stock rises, the calls become more “in the money,” and so market makers would need to increase their delta hedging (buy stocks).
That may add to buying on days when a stock is up, and selling on days when a stock is down. That in turn, has the potential to increase momentum and result in more day-to-day volatility, especially in high-priced stocks.
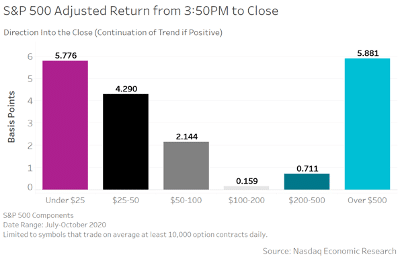
We test that theory by looking at the relative performance of S&P500 stocks in the last 10 minutes of trading for all stocks with more than 10,000 options average daily volume (ADV). Taking stocks with significant positive (or negative) moves for the day (>1%), we then look at market-adjusted performance in the last 10 minutes of the day. Essentially, a positive result in Chart 4 shows momentum and volatility in excess of the market over the last 10 minutes of the day, which would be consistent with a positive gamma hedge.
It turns out those higher-priced stocks tended to see exaggerated moves into the close between July and October this year, on average, outpacing the momentum of the rest of the market by almost six basis points into the close.
Although we note that low-priced stocks, with far less relative options activity, also had higher momentum into the close. So it’s possible there are other factors at play, or gamma is not directly related to trading activity levels.
We also see that generally, all stocks that are up (or down) during the day tend to continue that way into the close, which might highlight the relative cost-of-completion for large institutional orders.
Chart 4: High priced stocks also seem to have more momentum into the close lately
This might be yet another good reason for high-priced stocks to split.
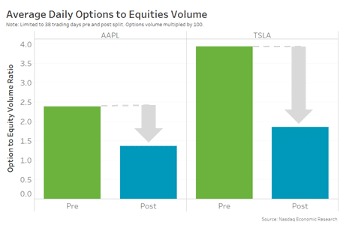
The AAPL and TSLA stock splits led to a dramatic drop in options activity
Speaking of splits: With a couple of months of data, we can now look at the results of the recent AAPL and TSLA stock splits to see if the splits improved trading. The answer is generally: Yes.
For a start, what we already see is that, almost immediately after the stock split, relative options activity in these two stocks fell significantly.
Chart 5: Relative options trading ratio fell after both splits
Looking at stock data, we also see that, in addition, most of the tradability improvements we expected to see have also occurred:
- Spreads are tighter than before the split (despite the ticks being wider)
- Odd lots have fallen around 50%
- Value traded has increased (a little)
Chart 6: Tradability metrics for AAPL and TSLA have improved post-split
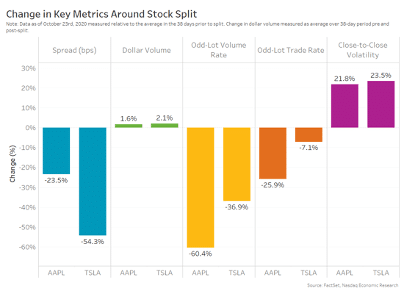
Close-to-close volatility has also increased. That’s consistent with prior studies, but also potentially misleading given the selloff in tech since the splits occurred. Stimulus discussions and 2020 election risks caused the whole tech sector to underperform on elevated volatility. We might need to wait for more normal market conditions to be able to get comparable data on that.
What does this all mean?
The record options volumes we’ve been seeing look, at least in part, to be coming from the increased retail activity in the market.
That’s likely contributing to the growth in single stock calls, especially in high-priced (tech) stocks, which may, in turn, leave market makers with gamma hedges that could exaggerate price moves and volatility.
This might be another good reason to split some stocks. Recent data shows AAPL and TSLA stock splits have improved most of their tradability metrics since their split.
What Options Tell Us About Stock Splits was originally published by Nasdaq.