


By Phil Mackintosh, Senior Economist, Nasdaq
In a recent study, we analyzed IPO first-day returns, finding a positive average first-day return for IPOs (sometimes called the IPO pop) that was mostly accounted for in the opening auction. We also saw other factors, such as whether the placement price is at the high end of the range, tend to show what day one returns are usually like. However, we also saw a lot of unpredictability, or risk, pricing new companies, which partly explains the premium these companies receive on listing.
Today, we analyze the long-run performance of IPOs to determine whether this performance justifies large IPO pops.
Early stock valuations are mostly based on future cash flows
We’ve shown before that each stock’s earnings are an important factor driving stock price. If a stock’s forecasted earnings are strong, the stock will be rewarded with a high valuation. If earnings are weaker, investors will expect lower dividends and capital growth, and prices will adjust to reflect those expectations.
However, because markets are efficient, smart investors don’t just look at historic earnings; they also estimate future cash flows. That is why “growth” stocks tend to have higher multiples (e.g., price-earnings ratios) than value stocks. Investors will pay more now for higher earnings in the future.
That also means the IPO pop includes a lot more uncertainty, as most of the growth of a new public company’s earnings is estimated.
However, over time, actual financial results will show whether investors on day one were right about the future of the company. As more information is reported, analysts will reassess valuations and earnings growth more accurately, and a company’s stock price will reflect that.
Almost all companies are unprofitable when they IPO
Data show that the majority of new companies coming to market are unprofitable when they IPO. Since the 1980s, unprofitable IPOs have risen from around 20% to 80% of the total IPOs each year (Chart 1).
Despite that, the average first-day return of unprofitable companies has on average exceeded the first-day return of profitable companies over the last 41 years. However, unprofitable companies have only had higher first-day returns in 17 of those 41 years (approximately 41% of the time).
Chart 1: The proportion of unprofitable IPOs has been rising

However, just because a company is unprofitable when it raises public capital for the first time doesn’t mean it will be unprofitable over the longer term. That makes sense if fixed costs of building a new product and penetrating an existing market are high.
Some research by Jay Ritter shows that IPO companies coming to public markets now are older than companies coming to market years ago, suggesting these start-up costs are also increasing (and that the path to profitability is longer), despite the disruptive forces of technology (Chart 2).
Chart 2: Age of new IPOs

Over the long run, IPO returns deviate significantly
Given all this, it’s interesting to look at what happens to IPO stock prices in the years after a company first IPOs, especially as it gives insight into whether earnings growth expectations on day one are accurate (and the market is efficient) or not.
We analyzed the performance of companies that came to market between 2010 and 2020.
What we find is long-run performance varies significantly, and even more so the longer the timeframe. In Chart 3, we show the distribution of IPO performance up to three years post IPO. The colors show the magnitude of out (or under) performance. For example, the day after the IPO, just over 50% of companies outperformed the market (green colors), with a quarter (26%) of companies beating the market by less than 2.5% and another quarter underperforming by less than 2.5%. That shows that mostly the overnight placement price is close to the valuation struck in the market on day one.
However, a year later, we see that the majority of companies are either outperforming or underperforming the market by more than 10%. We also see that more companies are underperforming than beating the index (the red bars stretch below the 50% line).
That seems to indicate that for some companies, the initial IPO enthusiasm wanes or expected earnings are not met, and investors reprice the IPO to reflect the actual, slower growth of the company.
Chart 3: Most IPO returns turn negative in the long run

A few IPO winners outpace those who underperform
Three years after their IPO, we calculate that almost two-thirds of IPOs are underperforming the market, with most (64%) more than 10% behind the market’s returns.
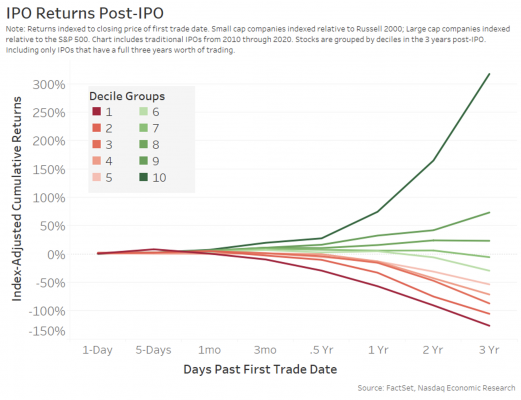
However, while the outperformers only represent around 29% of the total IPOs, they outperform by much more (on average), with some doubling or tripling in price (Chart 4). The data show that the top 10% of IPOs earn an average market-adjust return of over 300%, while stocks in the 9th and 8th deciles earn significantly lower market-adjusted returns of 75% and 25%, respectively.
Chart 4: IPO returns by decile group
Does profitability at the time of IPO matter?
One interesting question, given what we discussed above, is how unprofitable IPOs perform.
That’s something Jay Ritter has studied. Based on his results from a much longer period (1980 to 2019), he finds that sales matter more than profits. His data (Chart 5) shows that:
- Companies with greater sales on the date of their IPO perform better than those with smaller sales and less established market penetration. Companies with less than $100 million in sales tend to underperform the market post IPO, whether they are profitable or not. While companies with more sales slightly outperform over a three-year period.
- Unprofitable companies see exaggerated results. Unprofitable companies with small sales underperform more, while unprofitable companies with higher sales outperform more.
This also likely supports the observation that companies are now waiting longer to IPO, making sure their sales and market presence is larger before going public.
Chart 5: Long-run IPO returns for profitable vs. unprofitable IPOs

What does this all mean?
Bringing more new companies to public markets is great for most U.S. households, as they are mostly only able to invest in listed companies.
However, the data on long-term performance highlights the benefits of diversification for most investors. Pricing new IPOs accurately is hard; entering new markets is even harder. But for those companies that can do that, grow revenues and ultimately profit—the returns are rewarding.
Just another reason why we continue to work hard to help new companies join U.S. public markets.
Robert Jankiewicz, Research Specialist for Economic Research at Nasdaq, contributed to this article.