


Our new approach to assessing market impact, and the results we have observed within Asia-Pacific’s cash equity markets.
By UBS APAC Quant Analytics and Distribution team
Planning is critical to traders’ workflow in translating a portfolio manager’s objective, news headlines, related flows and other information into execution intention and, in turn, algorithm selection. Understanding the cost of liquidity and impact cost across both individual and basket of orders is critical for strategy selection, calibration, post-trade transaction cost analysis (TCA) and performance reviews.
The hunt for liquidity entails constant optimization between impact and signaling in the market, while trying to minimize risk and execution cost. This is graphically represented in Figure 1.
“Before anything else, preparation is the key to success.”
Alexander Graham Bell
Trader’s Dilemma plots execution risk versus impact cost trajectories. As your trading horizon increases, the risk of deviation from your desired execution price increases while the order’s impact on price decreases. Risk-adjusted cost consists of impact cost plus execution risk. Given that execution can express a variety of risk appetites (or urgencies) from the trader, the risk-adjusted cost converges to the impact cost as ‘Urgency’ to execute reduces.

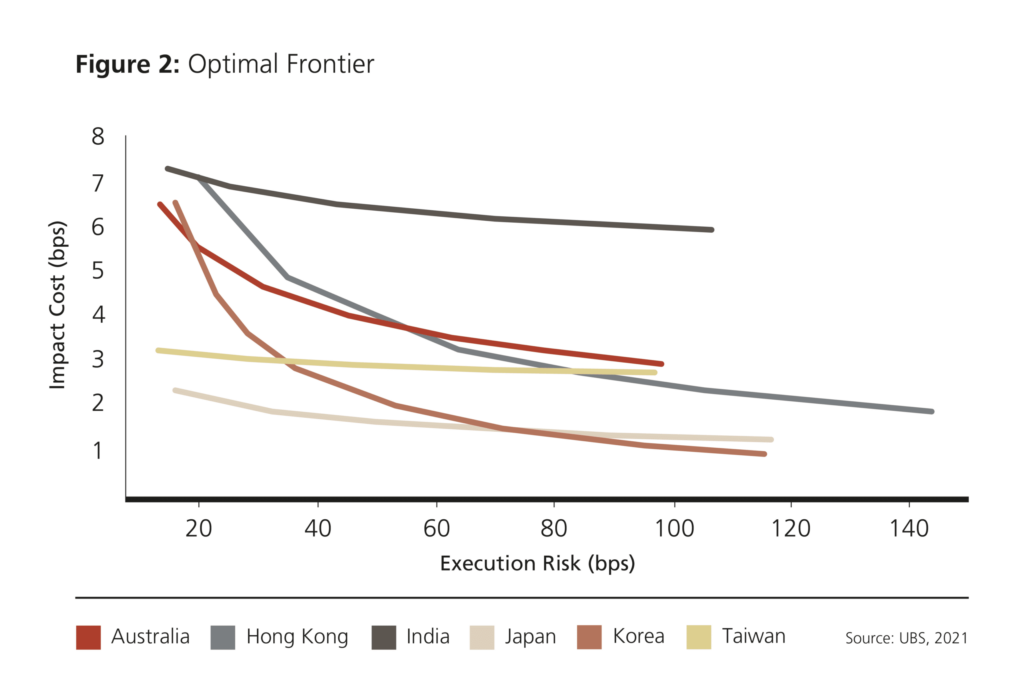
Optimal frontier shows the expected impact cost for a standardized basket in different APAC markets, in this case USD10mn baskets, further highlighting the diversity across APAC markets. For a fixed notional basket, each market is faced with its own investor composition, regulatory, market structure and microstructure nuances. This explains the differing shapes of optimal cost/risk frontiers for each one.
UBS tackles the topic of market structure changes and regulatory updates and their impact on trading patterns through insights channels such as the UBS Microscope articles and Market Structure Spotlight seminars.
ASIA-PACIFIC: HETEROGENEITY, DIVERSITY, INCONGRUITY
Asian equity markets pose a trading challenge versus those in Europe or the US on account of variability of liquidity (largely concentrated on the primary venue), wider bid-ask spreads, and less active non-displayed venues. In addition, key market microstructure characteristics, driven by idiosyncratic market regulations, differ significantly among the prominent markets. This makes it a challenging task to estimate liquidity capture and market impact within a single model.
A NEW WAY TO CONSIDER ESTIMATED MARKET IMPACT
Traditional market impact models use order characteristics such as trading duration, participation rate and volatility to assess the impact of an order in the market. These traditional models typically assume mostly frictionless trading and uniform market microstructure characteristics amongst the stocks. In APAC, these assumptions do not hold true: ASEAN markets typically show wide bid-ask spreads and long queues at the touch, whereas markets like China and Hong Kong have a combination of wide spreads plus low volatility stocks mixed in with more liquid stocks. In addition, market factors like uptick rules on short sells have led to asymmetry, while the presence of hidden liquidity in markets like India and liquidity venues such as ASX Centrepoint have made traditional market impact models less effective.
“Vision without execution is delusion.”
-Thomas Edison
EMBRACING DIVERSITY
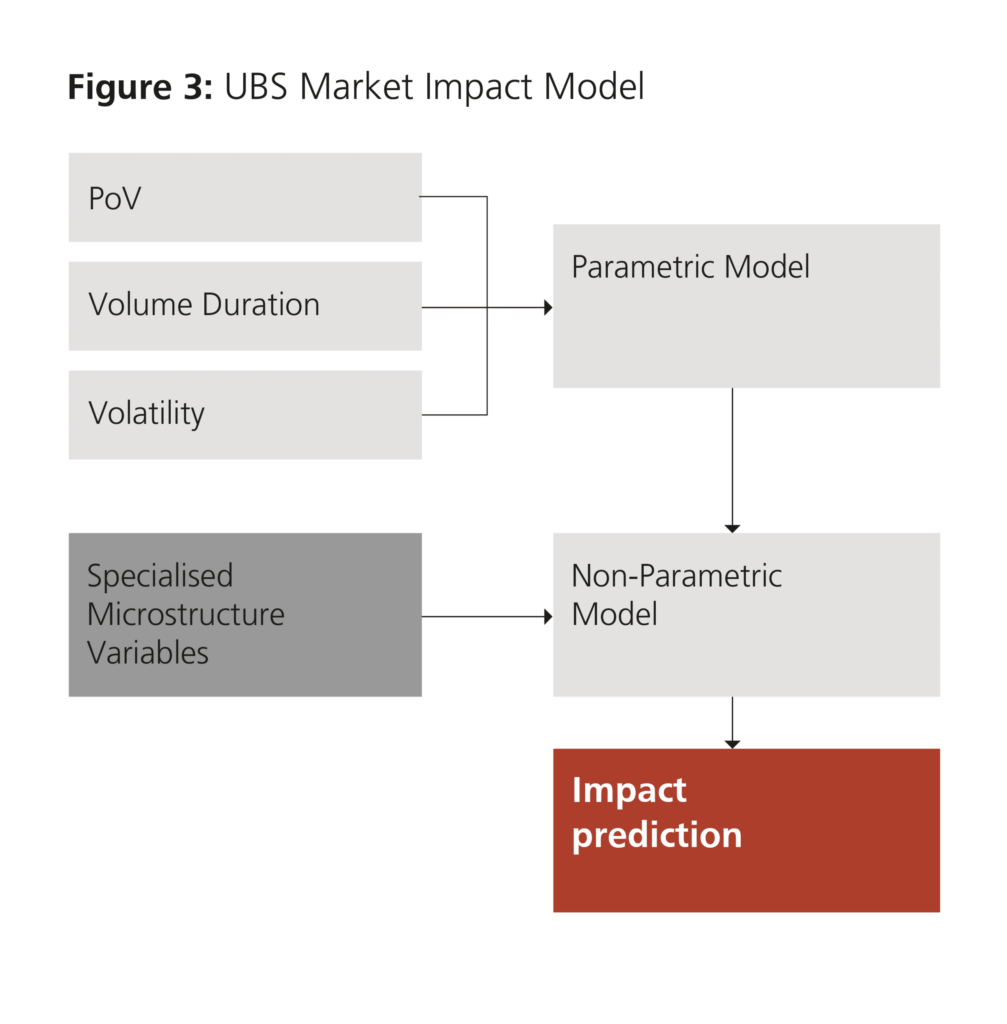
The UBS approach embraces the diversity of APAC microstructures and incorporates them into our Market Impact model for Asia.
Assessing Liquidity Cost consists of two parts: order and market microstructure factors, which can differ substantially across APAC markets. It is a two-stage “mixed model” approach that breaks down the two components into individual factors that contributes to the overall Liquidity Cost.
Order factors such as the percentage of volume, duration (measured in volume time instead of actual time for normalization) and volatility are used to calculate cost of execution within the parametric model. This is a traditional estimation of market impact model with an intuitive linear relationship between order factors. For example, increasing percentage of volume while decreasing duration would correlate to increased impact.
Our updated Market Impact Model is formed by combining the results of the (order) parametric model as an input together with market microstructure factors. The advantage of this formulation is that while the assumptions of the parametric model broadly hold, the impact cost is less affected by market microstructure factors. Conversely, when the markets are harder to trade the microstructure factors have a heavier weight and can produce more accurate estimates.
The market microstructure factors chosen for the model combine traditional factors like bid-ask spread, average size of the top of the book and so forth, with non-traditional factors that are part of UBS Microstructure suite of analyses. The latter includes SpreadTau (a representation of stock volatility on the time domain) and bid-ask bounce (a normalization of quote stability of a stock).
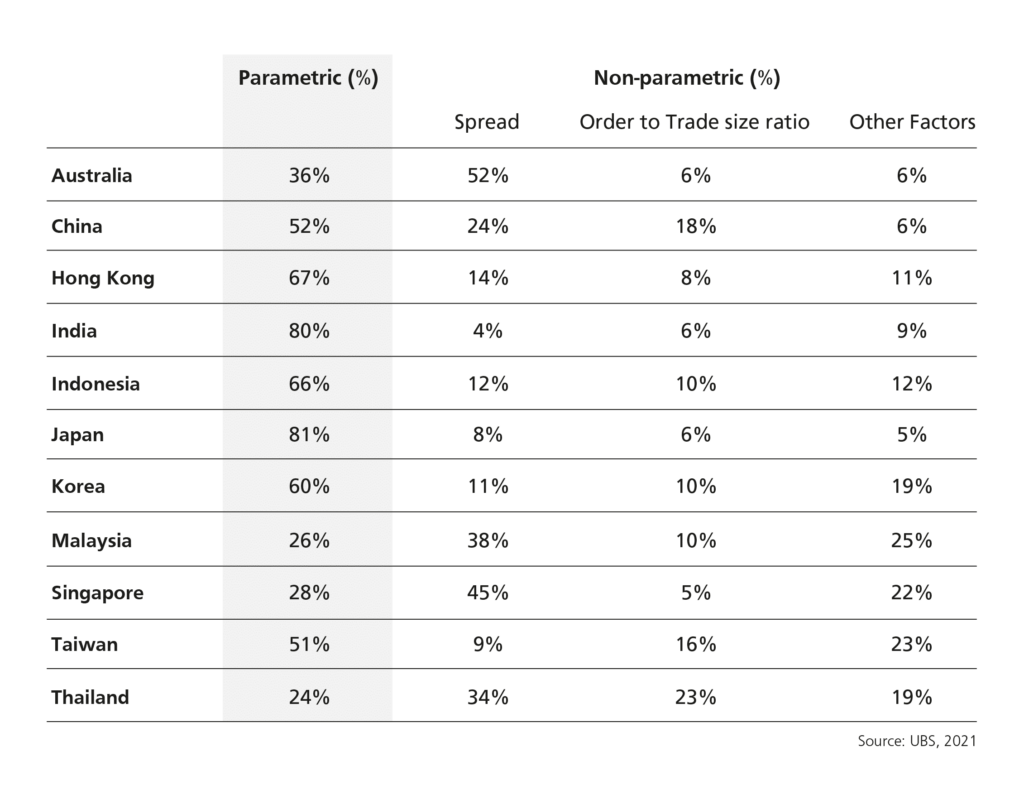
The benefit of such an approach is also realized in a pragmatic manner. Moving away from assessing impact as a reference to one numeric value, we can provide the trader an understanding of the key contributing factors towards impact for a given market to help plan execution approach. Here the ‘importance feature’ methodology is used to represent the influence of parametric and non-parametric factors as observed in our base calibration. As reference, the example table below shows the results from an earlier point-in-time calibration.
The traditional parametric model is still relevant in markets like Japan and India, where the queue sizes are thin and the market moves quickly in small tick increments. Market factors are more significant in markets with wider bid-ask spread and thicker quote books such as the ASEAN markets. There, liquidity cost is best measured through factors such as the spread and size at the top of the book. Australia breaks this mold and favors a non-parametric model despite thin queue sizes and small spread, given the large amount of liquidity and price discovery that occurs through the auction periods and liquidity venues such as ASX Centrepoint.
UBS’s pre-trade analytic tool incorporates this mixed-model approach so we can provide our clients with the most accurate measurements in response to their needs for liquidity risk management. We are constantly calibrating and improving our models to help our clients make the most informed decisions around impact cost and duration risk when trading in today’s challenging markets. The pre-trade tool also allows clients to easily delineate individual stocks with liquidity constraints to better skew sector biases within a basket of stocks. This empowers the buy-side trader with additional data points to assess the value of liquidity in various scenarios and better tailor their execution strategy.
Pre-trade tools serve as independent guides that help clients identify indicative cost references, and thus help them make more informed decisions. However, in managing child order execution, UBS’s latest mathematical calculation engine employs its own continuous cost-benefit trade off optimization to minimize trading cost at run time. This data-centric approach, along with the tunability offered by the model, allows us to measure and address performance demands in an ever-changing, complex marketplace.
Proof in the pudding: Putting the model to the test
The new model shows statistically significant improvement over traditional parametric models.
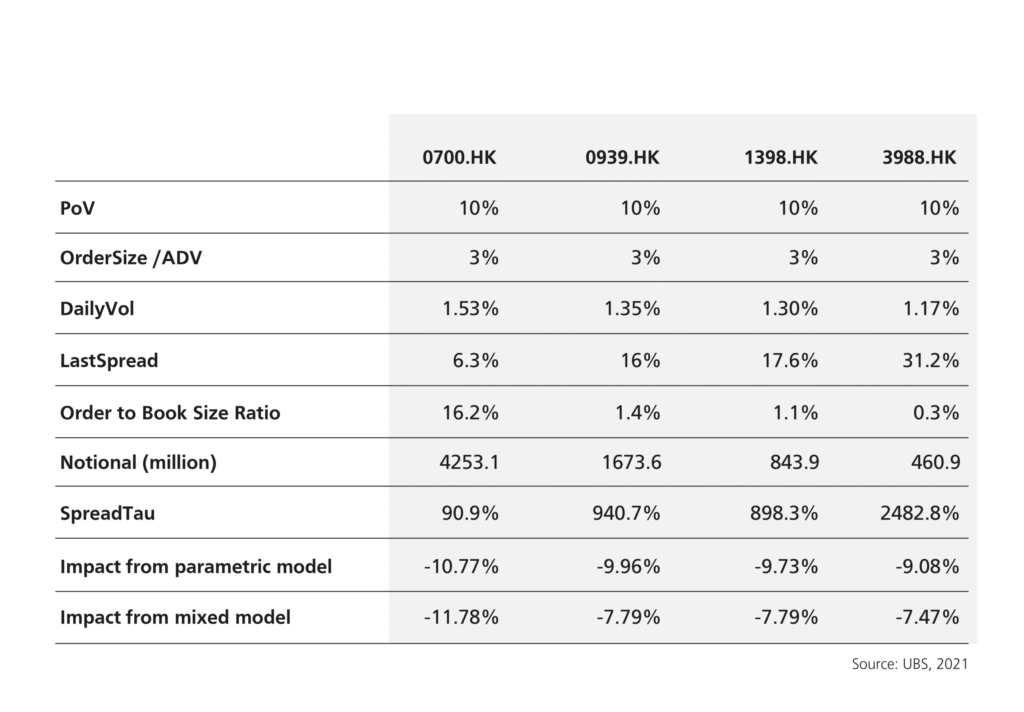
As an example, we looked at some notable stocks in Hong Kong.
0700.HK has a short queue, with lower top book size and higher order size/top of book size, resulting in higher estimated impact.
0939.HK, 1398.HK and 3988.HK usually have long queues, with lower estimated impact.
In this case, book to trade ratio factor has a dominant effect in the new model, which increases impact predictions for 0700.HK while reducing impact predictions for the rest of the names.
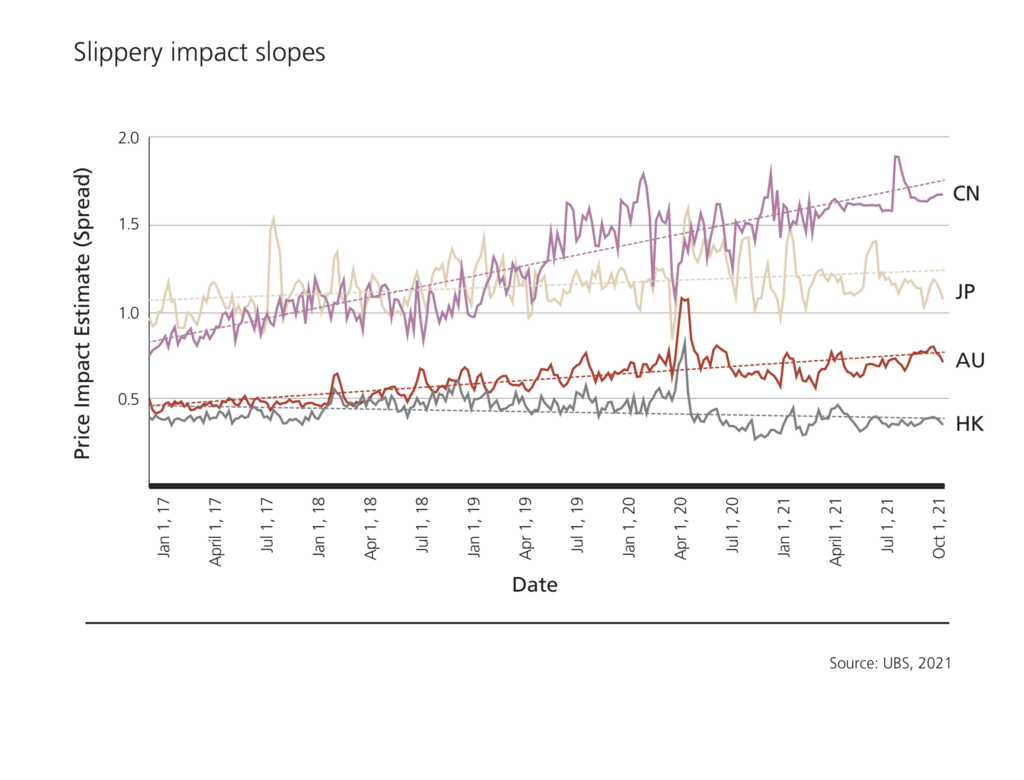
Using the new model, the chart below shows price impact trendlines across Australia, China, Hong Kong and Japan of a 5% ADV basket traded over the day.
The Art of the Pre-Trade: Assessing the Cost of Liquidity in APAC Markets first appeared in the Q4 2021 issue of GlobalTrading.
————-
This material is for distribution only under such circumstances as may be permitted by applicable law. It has not been prepared with regard to the specific investment objectives, financial situation or particular needs of any specific recipient. It is published solely for informational purposes and is not to be construed as a solicitation or an offer to buy or sell any securities or related financial instruments or to participate in any particular trading strategy. Options, derivative products and futures are not suitable for all investors, and trading in these instruments is considered risky. The recipient should not construe the contents of this material as legal, tax, accounting, regulatory, or other specialist or technical advice or services or investment advice or a personal recommendation. Foreign currency rates of exchange may adversely affect the value, price or income of any security or related instrument mentioned in this material. No representation or warranty, either express or implied, is provided in relation to the accuracy, completeness or reliability of the information contained herein except with respect to information concerning UBS AG, its subsidiaries and affiliates (UBS), nor is it intended to be a complete statement or summary of the securities markets or developments referred to in this material or a guarantee that the services described herein comply with all applicable laws, rules and regulations. It should not be regarded by recipients as a substitute for the exercise of their own judgment. Any opinions expressed in this material are subject to change without notice and may differ or be contrary to opinions expressed by other business areas or groups of UBS as a result of using different assumptions and criteria. UBS is under no obligation to update or keep current the information contained herein, and past performance is not necessarily indicative of future results. UBS, its directors, officers, employees or clients may have or have had interest or long or short positions in the securities or other financial instruments referred to herein and may at any time make purchases and/or sales in them as principal or agent. UBS may act or have acted as market-maker in the securities or other financial instruments discussed in this material. Furthermore, UBS may have or have had a relationship with or may provide or have provided investment banking, capital markets and/or other financial services to the relevant companies. Neither UBS nor any of its directors, officers, employees or agents accepts any liability for any loss or damage arising out of the use of all or any part of this material or reliance upon any information contained herein. Additional information may be made available upon request. Not all products or services described herein are available in all jurisdictions and clients wishing to effect transactions should contact their local sales representative for further information and availability. © UBS 2020. All rights reserved.
This analysis has been provided by UBS, for informational purposes only and should not be used in substitution for the exercise of independent judgement.
This material contains data derived as a result of back-testing of data and is provided by UBS in good faith using its standard methodology for information of this kind. That methodology relies on proprietary models, empirical data, assumptions and such other information that we believe to be accurate and reasonable. The current data that UBSselected for preparation of this material may be substantially different if the date is selected from a different time period and this may have substantial impact on the back-testing results.
This information is provided to you for information purpose only and UBS makes no representation as to the accuracy, completeness or appropriateness of such methodology and accept no liability for your use of the information. Specifically, there is no assurance that other banks or brokers would derive the same results for the back-test period or that such results would have been achieved in practice. Potential investors should not rely on this material for the purpose of understanding the probability that they may lose their initial investment in investing in the subject product.
Prospective investors should also note that back-testing results may project unrealistic expectation on the performance of the subject product. Past performance is not necessarily indicative of future results. This material does not guarantee the performance of the subject product in all circumstances and UBS shall not be responsible for any investment loss suffered by the investors in investing in the subject product in this respect.
The back-testing results has not considered the risks involved in investing in the subject product, including but not limited to the credit risk of the issuer of the subject product. These risks may lead to the loss of investors’ initial investment in the subject product and investors should read the risks stated in the offering documents of the subject product before investing in the subject product.
Under no circumstances shall UBS have any liability for a) any loss, damage or other injury in whole or in part caused by, resulting from or relating to, any error (negligent or otherwise) of UBS in connection with the compilation, methodology, interpretation, communication, publication or delivery of this analysis, or b) any direct, indirect, special, consequential, incidental or compensatory damages whatsoever (including, without limitation, lost profits), in either case caused by reliance upon or otherwise resulting from or relating to the use of (including the inability to use) this analysis.
This analysis is confidential. UBS specifically prohibits the redistribution or reproduction of this material in whole or in part without the prior written permission of UBS and UBS accepts no liability whatsoever for the actions of third parties in this respect. © UBS 2020