


The recent splits of AAPL and TSLA drew a lot of media attention. A common comment was “splits don’t change the stock fundamentals, so they shouldn’t affect valuation.”
But that’s not true. Splitting fundamentally changes how stocks trade. That can make it cheaper for investors, improving their returns. In turn, when investor returns increase, stock valuations should outperform.
In fact, seemingly small things like market structure and trading costs are important to the economy.
Splits help stocks trade higher
Quite a lot of academic research shows that stocks that split tend to outperform the market. We updated these studies with newer data. What we found was (still) a compelling case for stock splits.
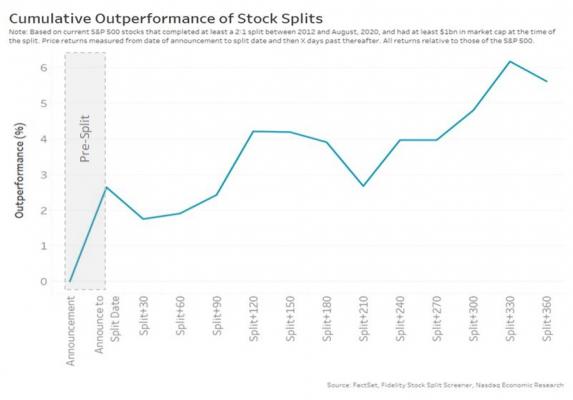
Overall, large cap stocks that split outperform the market by an average of 5% over the next 12 months. Just announcing a split causes the average stocks to outperform the market by 2.5%, indicating the market expected gains even before tradability improves.
That’s consistent with academic research in 2009 that found that liquidity improvements following stock splits reduced average companies cost of equity capital by 17.3%, or 2.4 percentage-points per-annum. This is a material boost to both issuers and investors.
Chart 1: On average, stocks doing splits outperform the market as soon as the split is announced and even more over the next 12 months
Trading for investors gets easier and cheaper
A big question we get is, “Why would a split make trading easier?”
Let’s start by looking at the factors that make trading more expensive. There is established literature and models that measure what causes market impact. Overall, there are three main factors as that drive most trading costs:
- Spreads: the percentage difference between bids and offers.
- Liquidity: the typical value traded, which also limits how much stock can be bought in a day.
- Volatility: reflects the risks of losses for market makers providing liquidity; in turn, low volatility also helps keeping spreads tight.
Continually measuring and recalibrating using actual trading data by the TCA industry confirms this.
Over a longer timeframe, research also shows that impact costs have been falling for decades. That’s in part to spreads falling and liquidity increasing market-wide. You can also see that ITG (now Virtu) estimates that smaller stocks—which tend to have less liquidity, wider spreads and more volatility—also cost more to trade.
Chart 2: Tradability metrics mostly improve

Looking at these tradability metrics for stock-split tickers in Chart 2, we see that on average:
- Spreads: improved by 22%, with 89% of stocks seeing better spreads.
- Liquidity: Value traded increased 18%, with 70% of stocks seeing better liquidity.
- Intraday volatility: reduced 3%, with 66% of stocks seeing lower volatility.
Those changes all contribute to lower trading costs. And when costs go down, returns go up, and valuations increase.
Chart 3: Reducing trading costs should increases valuations as it increases net returns

One counterintuitive finding is that close-to-close volatility increases. Interestingly, academics agree and despite numerous studies, they are unable to find a definitive answer. In any case, intraday volatility is more important for traders, as orders are worked during the day, so lower intraday volatility will attract more liquidity providers and reduce impact costs.
Why does stock price affect tradability?
The answer to this question actually requires some understanding of market structure and trading rules.
It starts from the fact that in the U.S., all stocks trade under a very similar set of rules and sometimes that “one size fits all” approach results in very different trading. We highlight two specific rules that seem to matter the most: Tick sizes and round lots.
At a very basic level:
- Low priced stocks have ticks that make spreads too wide. That increases queue lengths and trading costs. Their spreads are wide by definition.
- High price stocks have too many ticks and a large round lot. All those ticks make it easier to jump queues. The large round lot makes it expensive to post bids and offers cheaply. Their spreads are wide because trading is difficult.
- In between is a price level where the tick more closely represents the tradeoff for immediacy and liquidity. Those stocks trade with the lowest spread costs.
Chart 4: Ticks and Round lots change as stock prices increase

Artificially wide spreads will also get incorporated into portfolio manager models that determine after-cost alpha. That may, in turn, deter new investors or at least reduce the size of position they decide to buy.
The one-cent tick problem
So, how exactly does the one cent tick become a trading problem?
A tick is the minimum price increment that orders can use. In the U.S., all stocks have a tick of one cent. For example, you can bid $10.01 or $10.02 but not in between.
That one-cent-tick represents a very different cost for a $5 stock (20bps) than a $500 stock (0.2bps).
For low priced stocks, that means spreads can be “expensive” for investors to cross. We’ve shown before that that causes more investors to form in longer queues, or engineer queue priority solutions like paying for inverted venues or using mid-point orders. All of which adds to liquidity fragmentation and trading complexity.
But we’re more focused here on how ticks distort trading in high priced stocks.
Chart 5: High priced stocks have more tick levels and more odd lots inside the round lot, even if the market depth is exactly the same

Using the example stock in Chart 5 we compare a $1,000 and a $100 stock with exactly the same trading liquidity.
The upper chart shows that ticks on a $1,000 stock are worth just 0.001%. Even the most liquid companies in the U.S. markets have a spread closer to 0.01%. All those increments reduce the cost of jumping in front of (or “pennying”) buyers already in line (new buyer = green box). That penalizes the original buyer, who may miss fills, without really improving prices for those wanting to sell or reported spreads.
The round lot problem
The top chart in Chart 5 also highlights how high priced stocks have a round lot problem.
Almost all stocks in the U.S. also have a concept of a “round lot,” which is 100 shares. Historically that was designed to reduce paperwork on settlement and also ensure that benchmark spread prices reflected a meaningful trade value.
Because of that history, odd lots aren’t treated the same way as round lots.
Round lots are the prices the public see; they set the official spread that institutional investors use to compute trading costs, and they are “protected,” which means traders cannot skip over them to trade elsewhere (including off exchange).
In contrast, odd lots are neither visible nor protected on the consolidated data feed. That can increase costs for large buyers in two ways:
- Buyers trading off-exchange could trade at worse prices than available odd lot orders on exchange.
- Some institutional buyers using algorithms might miss odd lot liquidity on purpose. That’s because other research (on lower priced stocks) suggests sometimes odd lot orders give away too much information of large trades. To counteract that, many algorithms can (legally) limit trading to fills of 100 shares or more.
Round lots can also artificially widen spreads. As we show in Chart 4, the value of a round lot increases as price increases. Research we’ve done shows that supply and demand (the V-shape of bids and offers in Chart 5) is typically the same regardless of tick size. However, when the stock in the upper chart is split 10:1, the 50-share ($50,000) odd lots become round lots, automatically adding to the official quote and cutting the spread for the $100 stock in the lower chart in half.
More importantly, with larger increments and smaller round lots in the second part of Chart 5, an investor looking to bid ahead of existing buyers now needs to materially improve the spread (green box), and materially tightening the spread for sellers.
In fact, stocks trading with spreads around 1-2 ticks wide generally have relatively low levels of odd lots inside the official quote (Chart 6, yellow tickers). However, as prices climb, so too does the number of ticks between the bid and offer (black dots) and the probability that the true best bid and offer is an odd lot (diagonal slope of the grey dots). This also shows that the higher the stock price the worse the odd lot problem becomes.
Chart 6: Odd lots increase as stock prices climb as spreads trade 5-cents wide, which happens mostly for stock prices above $100

Even regulators know high priced stocks are a problem for traders
It’s not just Nasdaq saying this.
Regulators have also heard from investors about how hard it has become to trade high priced stocks and have also started to act.
- The SIP committee, responsible for putting together the consolidated tape, has proposed adding odd lots to the tape. That fixes the round lot problem but creates a best-ex problem if one share is setting the benchmark price.
- The SEC has proposed changing round lot sizes. That only partly fixes the round lot problem, but in trying to avoid the best ex problem also removes key investor protections by allowing trade throughs (Chart 7).
- In Europe, regulators have eliminated round lots and also changed tick sizes. That fixes for all these problems, but looks complicated.
Chart 7: SEC proposal to change trading rules for high priced stocks creates displayed but unprotected exchange quotes, allowing dark pools to ignore exchange liquidity at better prices

This lack of splits is not normal
It would be easier for all traders if stocks traded with roughly the same prices.
That’s probably why from 1930 to 2007 stock splits were so normal that stock prices held in a consistent range around $40 per share. Before 2007 it was rare for the S&P500 to have more than a few stocks over $100. Now there more than 100 (around a quarter of the index).
So the lack of stock splits is a relatively new phenomenon; it is decidedly not normal.
It seems to have been triggered around 2007, when Reg NMS was finalized. Those new trading rules helped make markets truly electronic and interconnected. That happened as markets were adapting to decimalization, which allowed spreads to collapse to that one-cent level.
Now, many share prices have climbed well past the levels where a one-cent tick remains a constraint. Instead, an increasing proportion of trading is happening away from exchange prices (Chart 8). That may ultimately harm price discovery and market efficiency and widen spreads further.
Chart 8: Exchange quotes make up less than half of all trades

What is the perfect stock price?
When put on a chart, spreads form a ‘U’ shape, where a moderate stock price has the best spreads, for almost all stocks (orange line in Chart 3). However, the bottom of the ‘U’ changes as liquidity falls. That means every stock has its own perfect stock price.
Chart 9: Perfect stock price depends on your daily liquidity (value traded)

The data in Chart 6 and Chart 4 use the same colors where tick constrained stocks are blue, stocks with too many ticks are black, and stocks with ticks that are “just right” are in yellow.
Interestingly, when you look at all stocks ranked by liquidity (Chart 6) you see the yellow stocks also typically have the best spreads (closest to the brown line). Spreads on other stocks seem to be consistently, and unnecessarily higher.
So calculating the perfect stock price is now a simple process of translating the spreads for your stocks liquidity into one or two ticks. For example, a stock trading around $10 million in notional value per day should target a 10bps spread. With a one-cent tick, that converts to a $10 to $20 stock price.
It’s interesting to compare the two most liquid stocks in the U.S.: AMZN and AAPL. Both trade around $10 billion each day, but spreads of AAPL sit very near the “optimal” brown line and odd lots are much lower. That seems to confirm that AAPL keeping its stock price just over $100 helps keep all investors more equal and make its stock easier to trade.
Splits fundamentally improve tradability and that boosts valuations
In short, tradability matters because it affects trading costs. The market’s reaction to stock splits, on announcement date, confirms that traders know costs matter to longer term valuations.
The fact that many IPOs price around $20 to $40 per share shows that investment bankers intuitively know where perfect stock prices lie too.
But the sweet-spot is different for every stock. It’s a point where ticks are not too wide and not too narrow.
What’s unusual, given all the benefits, is that stocks splits have become so unpopular in just the last decade. Let’s hope that changes.