


By Phil Mackintosh, Chief Economist, Nasdaq
Many consider the U.S. SIP to be the example for market data around the world. However, closer to home, it is at the center of a lot of the “data debate.”
Back in the 1990s, the approval of Unlisted Trading Privileges (UTP) meant that any exchange could trade a stock listed on Nasdaq or NYSE. We now have 16 different exchanges, all competing to quote and trade each stock. There are also around 30 dark pools (ATSs) and numerous single-dealer platforms that match trades off-exchange. Although they use quotes from the market, none of them provide quotes to the market.
The SIP only collects data required for trading
The SIP effectively stitches all that fragmentation back together. It consolidates best prices across all 16 exchanges in the U.S. market.
But the SIP only collects data required to meet trading rules. The SIP works out which exchange has the best bid and best offer nationwide (NBBO) and then shares that back with the marketplace (Reg NMS Rule 603). Those NBBO prices are protected (Rule 611), meaning the SIP is used to limit locked and crossed markets (Rule 610). The NBBO is also used to measure execution performance of “covered” orders (Rule 605) as well as ensuring off-exchange trades don’t happen at prices worse than exchange prices, protecting investors.
All other data—including non-marketable (think “out of the money”) quotes and cancelations, and details of very large order imbalances that require market makers to add liquidity to auctions—is optional and taken by relatively few, mostly sophisticated subscribers.
Chart 1: The SIP creates guardrails for all executions to protect investors

A pre-trade tape needs a focus on latency
By definition, as SIP is protecting quotes and trade-throughs, it is a pre-trade data source. That makes latency important.
Over the last decade, as computer power has increased, the U.S. SIP improved how fast it compiles all the data from 6 milliseconds (ms) to a 0.015ms delay. Capacity has also increased 33-fold.
Although a 6ms lag is undetectable to “human” traders, a 0.015ms still not fast enough for some automated traders. That’s because no matter how fast you make data, it is always delayed when it gets to users. If you want a single reference price for all users, you add additional geographic latency too. It’s just physics.
Despite all the investment and improvement in SIP processing, U.S. regulators recently suggested the only way to speed the SIP up is to allow anyone to compile their own BBO, forgoing the single “N”BBO that investors and the public prize.
Chart 2: Despite constant investment in SIP latency, benefiting fewer and more sophisticated investors, it will never be as fast as what those investors can see happening in the market

Although the SIP is good for the public, it’s not a public good
Because there are plenty of obvious benefits to investors from more public data, U.S. regulators never set out to make data “free”; quite the opposite.
They realized that they could use the SIP to make markets better if they made markets more transparent. To that end, the SIP set out to:
- Reward those for contributing to “good” transparent markets with NBBO prices and all trades.
- Charging those who consumed
The details of how this all works seem elegant at first, but even this system has created unintended consequences and inefficient allocations of resources.
Chart 3: SIP revenues charged to users are then reallocated, mostly to reward transparent markets

As the data in Chart 3 shows, professional investors who also make a living by investing and trading for their clients pay the largest share of the SIP. Retail investors pay around one-third of all costs. “Non-display” fees add to just 10% of the revenues earned by the SIP.
The data also shows that the majority of SIP revenues are shared back to those providing the actual data in the first place. In fact, we estimate the SIP infrastructure costs at just $27 million, or 6% of total revenues. That is based on estimates in the NMS-II rule filing (page 556) and extrapolating the reported $3.8 million UTP administrator fees across all three SIPs. Ironically, the NMS-II rule filing estimates the competing consolidators will add $78 million to industry costs (page 672) – which does not sound like a cost savings – but that’s a topic for another time.
Charging for SIP data based on use cases
How do you maximize the economic benefits from charging users for a centralized data feed?
As we discussed recently, some users make huge profits from data (some by trading a lot, others by not trading at all), but data is also important to researchers and the back office even if they earn no income from it at all.
The SIP plans tried to solve for different users economics by offering different deals to media, small traders, professionals and computerized trading, as we show in Table 1.
Table 1: SIP rates sheets charge different users based on their expected usage of the data
Summary of Selected Consolidated Market Data Fees by Tape

Source: Nasdaq Economic Research
Like all businesses, getting SIP data to a customer involves a combination of fixed and variable costs. Consequently, charging fixed access fees ensures that small users are not able to free ride off those with hundreds or thousands of customers.
Then, the SIP offers a menu of per-user charges based on usage patterns:
- Retail can pay a per query rate of $0.0075: This represents a fraction of the average $10,000 trade in the U.S. (actually 0.008 basis points).
- Retail that is more active can pay a monthly rate of $1 per tape: This is for “non-professionals” that elect to pay a flat rate. This is a fraction of the likely value of their first trade.
- TV and media pay 0.5-cent per month, per user: Although that is a fraction of the “unlimited data” rate for non-professionals, none of the millions of “eyeballs” watching will trade through their TV. Instead, the channel earns advertising revenues based on the eyeballs.
- Professional investors have a monthly rate of around $90 for all tapes: Professionals include broker-dealers and investment advisors, who earn significant profits from client trades. Their $90 feed provides them with a constant stream of quotes on all tickers for the whole month with a delay that human eyes cannot detect.
- Computers pay around $9,500 per month: Clearly, computers can do the work of many humans. It makes sense (to the humans) that algorithms pay more for SIP data.
There is also a cap of $500,000 per month available for all brokers. Some have more than 20 million accounts and find that the per-user rates add up quickly.
SIP revenues have changed little over a decade
Data shows that all the different consumers contribute to a SIP revenue pool of around $400 million each year, and that has been relatively stable over the past decade. However, the spike in retail trading in 2020 appears to have resulted in a jump in new customers, pushing SIP revenues back above $400 million per year for the whole industry.
Although with U.S. market liquidity of over $240 trillion each year, that’s a cost of just 0.00017% per dollar traded, which is a fraction of the spread on the most liquid U.S. stocks (currently at 0.01%).
Chart 4: SIP revenues were falling until the 2020 wave of retail trading boosted the customer base

Source: Nasdaq Economic Research
How are SIP revenues earned?
As more and more trading in the U.S. moves off-exchange, lit markets become even more important. Ensuring we have competitive public quotes helps tighten spreads.
Chart 5: A large proportion of U.S. trading occurs off-exchange or at hidden prices; the SIP ensures the best visible prices (green bar) are available for all

Source: Nasdaq Economic Research
Because so much volume in the U.S. happens off-exchange (even historically), the SIP decided that quotes and trades should both be rewarded equally:
- Quotes x 50%
- Trades x 50%
In allocating revenue to each trading center, the dollar value (rather than shares) of liquidity is rewarded. A deeper quote, or more value traded, both earn a greater share of SIP revenues.
Help is also provided to thinly traded stocks. Because smaller cap stocks typically have wider spreads but lower volumes, the formula adds incentives to price discovery in those stocks by allocating revenue based on the square root of the value traded. That means a stock with 10 times the notional liquidity only counts for three times the revenues.
These effects are seen in Chart 6. Liquid stocks (on the left) fall below the green line (represented by their contribution to ADV) while thinly traded stocks (including BRK.A) earn relatively more revenues, showing the additional incentives for data on thinly-traded stocks. The color scheme also shows lower-priced stocks (blue dots) earn less than similar ADV high-priced stocks (yellow dots above), highlighting how the “value” of liquidity is the important factor, not shares.
Chart 6: SIP revenue per stock ranked by shares traded (vs. proportion of all shares traded in green)

For quotes, it is also important that liquidity is always available at competitive prices. To encourage that, quote revenue is also shared based on how long each exchange is providing quotes at the NBBO in each ticker (with a special way of removing flickering quotes from the calculation).
What you end up with is an allocation of SIP revenues to trading venues that roughly corresponds to how much trading and how competitive each exchange’s quotes are.
However, as elegant as this is, it still creates significant economic inefficiencies that are easy to see with examples.
Chart 7: SIP revenue allocations compared to quote quality

The SIP subsidizes fragmentation
Some aspects of fragmentation are a market “cost.” There are additional fixed costs for the market to bear, as well as additional liquidity search and opportunity costs.
However, because the revenues from all shares quoted and traded are equal across all venues, the formula takes no account of fixed costs. That subsidizes fragmentation as new venues have instant variable revenues just by decentralizing the existing quotes.
This can be seen by the yellow diamonds in Chart 7, which show the incremental benefits to investors (from more competitive spreads) as the number of UTP trading exchanges increases. It shows that most exchanges earn more in SIP revenues (purple bars) than they contribute, incrementally, to market quality.
We have also shown that proprietary data prices are more affected by market forces. That study found that many of the smaller venues are earning much more from SIP than proprietary data, with some unable to give proprietary data away free.
The SIP pays more to dark pools than their data costs
Market forces also currently result in most of the $73 million in “TRF” revenues (for off-exchange trades) being returned to off-exchange venues.
We estimate that for dark pools, these TRF trade revenues may more than cover those venue’s costs for exchange data (including the 16 ATSs that buy proprietary data feeds).
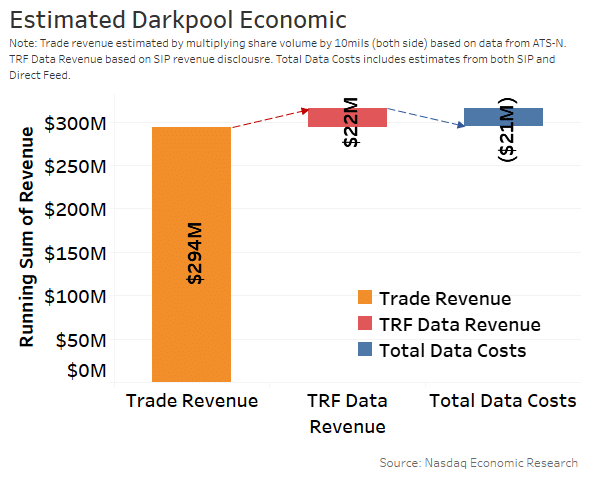
Chart 8: Estimated costs and revenues for all ATSs (industrywide)
How do we get that?
First, we estimate that ATS data costs based on Form ATS-N disclosures. This includes 16 ATSs that buy some or all of the proprietary data feeds, adding to $21 million paid for data to run their off-exchange order books.
Then, we looked at exchange filings that show that, thanks to competitive markets for data; the TRF revenues earned in Chart 8 above are not kept by exchanges but are mostly given back to customers who contribute that data. Those filings show Nasdaq shares up to 98% of all dollars it receives for eligible prints on the Nasdaq TRF and NYSE’S TRF Data Share Plan shares 85% (or more) with anyone with 0.1% market share. Given dark pools are around 30% of the TRF, this adds to around $22 million for all ATSs (with wholesalers getting most of the rest of the $73 million total). In other words, SIP trade revenues more than cover the data costs of the dark pools.
In reality, many dark pools likely execute some of their trades free as part of a bigger platform of offerings for their clients. However, if we allocated costs per trade of say five mils each side (which is well within the disclosed ranges of ATS fees), the industry-wide ATS trading revenues add to $294 million.
But wait: The SIP is growing!
Although this seems to prove that the SIP creates unintended cross-subsidies, misallocating resources and complicating markets, things in the U.S. may be about to change “big data” time.
First, the SEC decided last year in their NMS II proposals that it wanted to add a lot more data into the SIP. From five levels of depth outside the NBBO (see Chart 5) to odd lotsinside the NBBO.
Importantly, they also broke the nexus between data required in the SIP and data required for trading. Most of the additional data is not required for trading. In fact, the SEC expects that some competing consolidators may offer only top-of-book data.
That creates “choice” in whether investors want to buy all this extra data. Not knowing who the customers will be makes it even harder for the operating committee to decide what this extra data should cost each customer.
By our calculations, adding depth to the SIP increases message traffic more than tenfold. Should the depth feed cost 10x the top-of-book feed? Given the users of depth are likely to be professionals and (especially) electronic trading systems, should they pay even more, especially given the high-tech investments needed to process all this data quickly enough for trading? (The SEC requires depth feeds to be as fast as order-by-order proprietary feeds.)
Chart 9: Adding depth to the SIP increases messages by tenfold; should revenue increase tenfold?

Source: Nasdaq Economic Research
Other data from the SIP plans shows that professionals are a fraction of the total SIP users. In fact, electronic trading, which is most likely to benefit from depth feeds and the reduction in geographic latency, accounts for just 335 users.
Even if depth were offered at a per-message rate that is 90% cheaper than the current SIP, adding 10x the data would mean another $400 million that the SIP collects. Across 335 users, that’s $1.3 million each. Ironically, that is more than what it costs now to buy direct feeds from all exchanges in today’s market-driven proprietary data pricing.
Chart 10: The more sophisticated SIP customers get, the fewer of them there are to share additional costs

SIPs economic distortions
The SIP has never tried to be all things to all people, but it does represent the most important information to the majority of traders.
SIP accounting is complicated, and it creates economic inefficiencies.
There is a small and sophisticated group of traders who want much more from the SIP.
For the rest of us, a top-of-book quote lets us trade and measure executions, watch prices on TV, and provides all the functionality we need without the costs we do not want to bear.
What’s fair and equitable? It is a difficult question to answer.