By Hitesh Mittal, Founder & CEO, and Koushik Ganesan, Quantitative Analyst, BestEx Research
Higher participation rates in trading can indeed lead to greater market impact, but there are circumstances when trading at higher participation rates is justified. For example:

● In cases where investor redemptions result in larger trades
● When portfolio managers have strong convictions about a trade
● When the appetite for execution risk is low and a longer execution horizon is not feasible
● Trading small-cap stocks, where trading a high percentage of average daily volume is not necessarily equivalent to the same behavior in a large cap stock
While traders often have an intuitive sense of suitable participation rates for specific stocks and trade durations, such judgments can be somewhat arbitrary because they lack data-driven, empirical support. Interestingly, the SEC has proposed a rule (press release here) suggesting a predefined participation rate for mutual fund managers–irrespective of a stock’s market capitalization–in defining what constitutes a liquid or illiquid investment. The proposed rule updates the concept of “Reasonably Anticipated Trade Size” (commonly referred to as “RATS”) to classify investments as liquid or illiquid in a much more restrictive fashion. The proposal sets a fixed “value impact” threshold at 20% of the average daily volume for exchange-listed stocks, suggesting that trading any larger portion of daily volume would have a significant impact on the price of the stock. But a fixed, participation-based threshold for impact could have significant implications for mutual fund managers, particularly those with investments in small-cap securities.
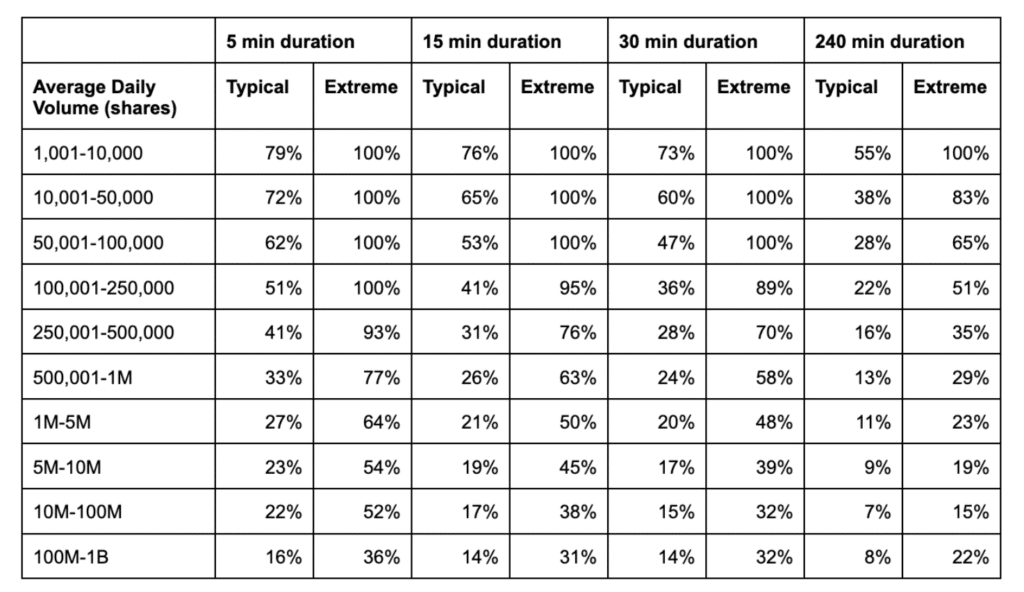
We propose an empirical approach using trade and quote data to determine appropriate participation rates based on what is commonly encountered in the market. To this end, we analyze aggregate buy-sell imbalances relative to trading volume (percent of volume) based on a quarter of trade and quote data. To calculate the buy-sell imbalance, we employ the Lee-Ready algorithm, assigning buy or sell indicators to trades based on their positioning around the midpoint of the bid and ask prices. The difference between buy and sell volumes provides the net trade imbalance for each period. We conduct this analysis for each trading day across all stocks in our dataset, observing both the median (referred to as “typical”) and the 95th percentile (referred to as “extreme”) of trade imbalance as a percent of volume.
The table below illustrates our findings for orders executed over a full trading day, categorized by varying levels of average daily volume.
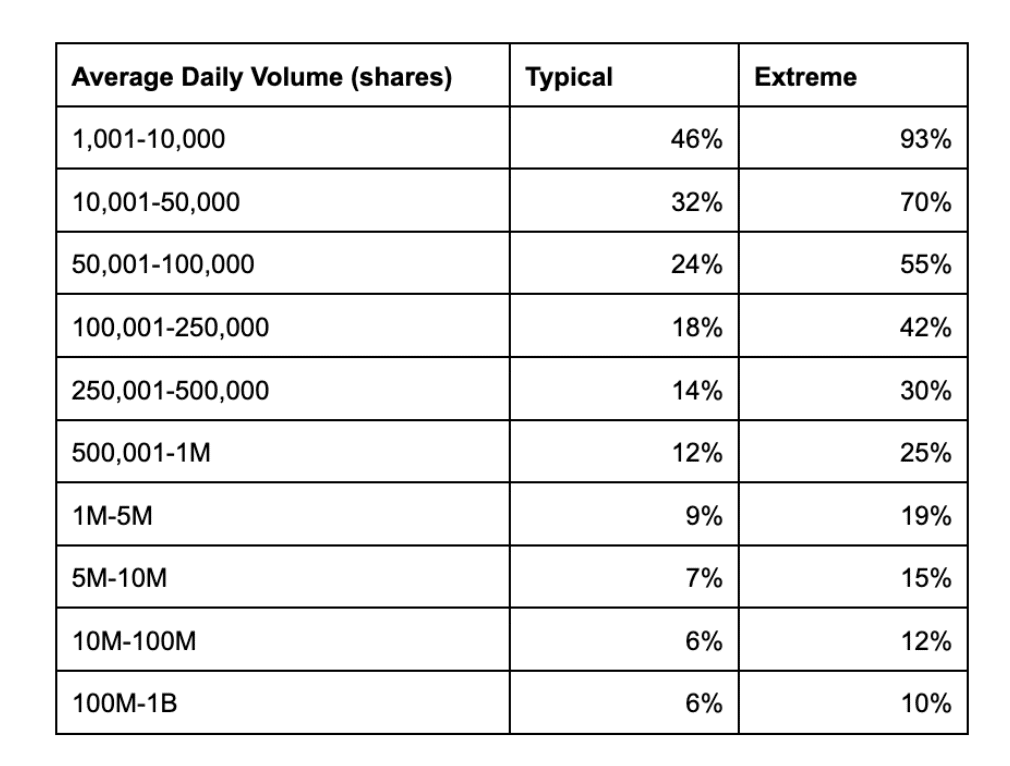
Our analysis reveals that “extreme” imbalances are significantly higher for less liquid stocks, implying that less liquid stocks can accommodate a much higher percentage of average daily volume in terms of trade impact. For example, for a stock with an average daily volume of 100,000 shares per day, a 24% trade imbalance as a percent of average daily volume is typical, and 55% of average daily volume is extreme, in clear contrast with the most liquid category where 6% is typical and 10% is extreme.
This analysis suggests that the SEC should reconsider the proposed value impact threshold for mutual fund managers, as the percentage of average daily volume appropriately labeled “high impact” should be higher for less liquid stocks and lower for more liquid ones.
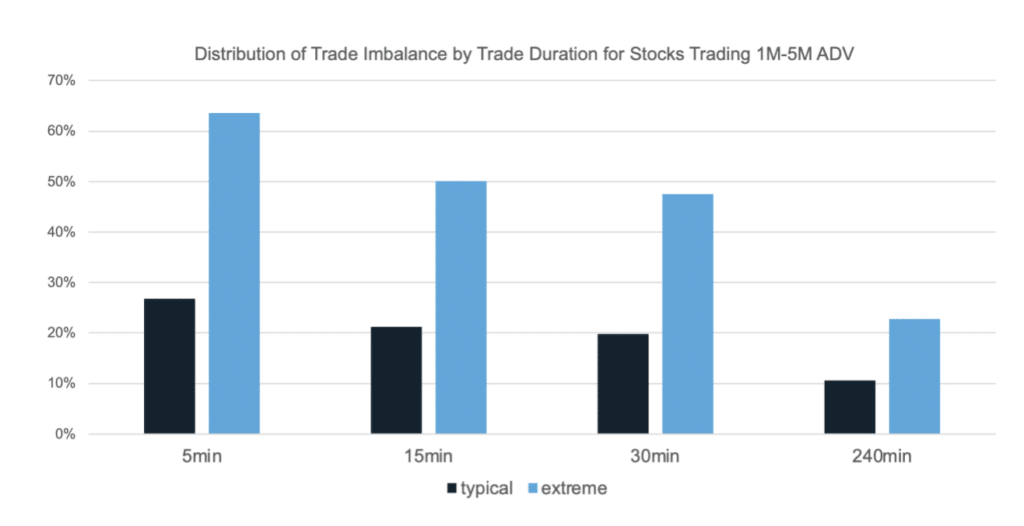
Moreover, we conducted this analysis for various trade durations, which has implications for how traders choose the speed of execution in urgent situations. Notably, both “typical” and “extreme” values can be substantially higher for shorter trade durations, aligning with market dynamics; markets tend to recover from temporary imbalances. The below image illustrates the set of typical and extreme values for stocks that typically trade between 1 million shares to 5 million shares per day. For example, for stocks with these liquidity characteristics, an imbalance of 11% is typical over a duration of 4 hours, while a typical imbalance for a duration of 5 minutes is much higher, at 27%. Extreme values are similarly disparate, with extreme imbalances over a 4-hour duration at 23% while 5-minute imbalances can be 64% at the extreme.
Details of imbalance distributions for all daily volume classifications can be found in the appendix.
It is important to note that the characteristics observed here aren’t exclusive to equities trading; similar principles apply to other markets, such as the futures market. We recently published a brief article on futures markets, reaching similar conclusions.
In summary, our data-driven approach provides insights into determining appropriate participation rates under varying conditions, offering potential guidance for regulatory decisions and helping traders determine participation rates based on order characteristics.
APPENDIX
The table below contains the typical and extreme imbalances for all average daily volume groupings based on the analysis described above.