


One of the conundrums created by the SEC’s new NMS II proposal is whether the market works better as a utility or a competitive market.
Some of the things the SEC proposes, like basing data revenues on costs and merging almost all market data into the SIP, speaks to the benefits that a stock market utility would create, although the usual benefit of a utility is avoiding duplicating fixed costs, which is not the case with creating competing consolidators.
Other aspects of their proposal, like creating multiple SIPs and competing consolidators, speak to a competition-at-all-costs approach to markets. Even though it’s well known that competition also adds to complexity and (fixed) costs.
NMS already tries to combine a competitive market (UTP) with nationalized data (SIP). But even with a data plan that rewards a market “good” (price discovery), we can still see the economic distortions it creates.
The costs of competition
Much of what happens in financial markets has a high fixed-cost component. Systems have to be built for peak capacity whether capacity is used or not. Critical (Reg-SCI) systems like the national quote also need to have fully functioning backups. That creates an interesting trade-off, where adding competition also adds fixed costs.
The SEC proposal suggested it costs around $10 million to run one SIP now. The UTP contract had been competitively tendered not too long ago, so that cost is already based in a (different) competitive process.
But let’s model out a hypothetical scenario under the new rules. Assume:
- Baseline cost of hardware and backup facilities and rent and power and compliance and people to run an SCI entity is $5 million.
- So making SIPs competitive could reduce costs another 50% based on the SECs suggested costs, meaning marginal cost savings of $5 million each are possible in this scenario.
- We model that each additional competitor is able to extract efficiencies of 20% on all providers. So adding one competitor would reduce the variable costs of both to $4 million each, adding another competitor reduces the costs of all to $3.2 million each, and so on.
- Even though all this competition will create a new SIP arms race, let’s pretend it doesn’t add costs (It would though, right?).
In this overly simplistic and far-fetched hypothetical example, after 12 competitors, the marginal costs of each competitor is reduced to less than $100,000 per year, adding theoretical efficiency gains of around $4.9 million per SIP provider (yellow line in Chart 1). But in the process of adding 12 competitors, we’ve duplicated fixed costs, adding $55 million to industry distribution costs (Chart 1).
Chart 1: Modelling how competing consolidators might add to industry costs even with competitive efficiencies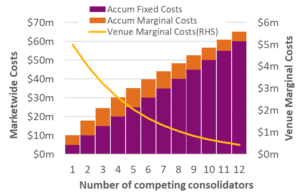
Source: Nasdaq Economic Research
So far, this just talks about covering the costs of the infrastructure (the new consolidators).
The larger economic “good” comes from having trusted public markets, getting companies to list, and participants to advertise quotes. Currently that’s also where most of the SIP revenues are spent.
What is the right “cost” for that?
So what’s the right cost for competitive prices data?
Interestingly, at FIMSAC this week, the SEC was busy discussing that for bonds.
We talked last week about how dealer markets work. Bonds are a classic dealer market.
The discussions at FIMSAC were focused on pre-trade transparency (public quotes), which don’t actually exist (TRACE only reports trades). Because of that, retail investors have no idea whether they are getting good fills or not. Not surprisingly, a detailed study found this costs retail investors (trading just corporate bonds) between $500 million and $1.2 billion each year.
FIMSAC also discussed how sophisticated investors (the buy-side) had built tools to save quotes sent to them by dealers. Given they connect to multiple dealers, their price data was more complete than the dealers themselves. During the COVID-19 selloff, this information asymmetry contributed to dealers widening spreads significantly. That proves it’s hard to quote competitively when you don’t know what the competitive price is, which speaks to the hidden value of a public and more equal market.
Ironically, SIFMA mostly supports the NMS II proposals to add depth and competing consolidators to equities, but they worry about the cost/benefit of developing a similar product for bonds.
Cost basis increases fragmentation
One of the complaints about the current SIP revenue formula is that, by paying any new exchange as soon as they print trades and quotes and the NBBO, they guarantee revenues which in turn supports more fragmentation.
However, the reason the SIP has revenue to distribute is because it currently gets all market data from exchanges and the TRF for free. Said another way, the two SIPs receive exchange data without a cost and revert the money the SIP collects back to the exchanges based on the amount of trading and price discovery (Chart 2). Contribution to price discovery is undeniably a “market good.”
Brokers know that unbundling can cause distortions where small cap stocks become under-covered, to the detriment of the market as a whole. SIP revenues are also mathematically “skewed” to thinly traded stocks, to add to incentives to provide quotes in those names.
Bond markets have realized price data is worth paying for, especially in thinly traded markets. Potentially it saves far more than the amount it will cost investors.
Despite that, there are still free-rider and other economic distortions caused by how the NMS market works. For example:
- Rebates paid (by exchanges) to the actual providers of quotes improve market quality, and therefore earn SIP revenues, but represent an engineered economic solution to pass the SIPs incentive back to risk takers.
- Equal access rules unbundle some market “rents” too. NMS allows competitors to trade using tickers and prices that other venues work hard to bring to the public market.
- A lot of trading is pegged to the lit NBBO without actually paying the liquidity provider who provides that quote. It’s estimated that price improvement on retail trading at sub-penny prices adds to around $1.6 billion a year, while midpoint orders save over $4 billion a year compared to crossing the full spread. That also puts into scale how much we should spend on keeping quotes tight and accurate.
In fact, most off exchange trades also earn SIP revenues for broker dealers (not exchanges). TRFs pass revenues from trading back to brokers based on their off-exchange market share.
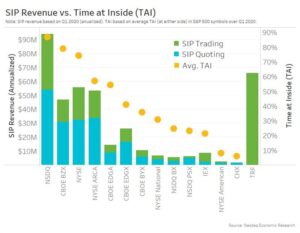
Chart 2: SIP revenues are currently allocated based on contribution to market quality, although quote (pre-trade) data makes up only 50%
In contrast, the current proposal considers paying providers based on their costs.
Basic economics says that covering costs would support inefficient businesses. Covering costs also distorts the incentive to close an unsuccessful business down. With over a dozen exchanges and more on the way, covering everyone’s costs seems destined to support fragmentation.
Fragmentation increases costs
It seems counterintuitive, but competition for competition’s sake could cost the industry more.
How much? We need to think what exactly it “costs” to run an exchange. We could start with IEX, who only operate one exchange. Their reported data shows that operating expenses in 2018 were more than $50 million.
- If that were all fixed costs, then the cost of running 16 exchanges later this year adds to around $800 million ($50 million x 16). Add two more exchanges, and costs go up $100 million more.
- If instead all costs are variable, we could say it costs around $20 million-per-percent-market-share. That gives a “fair” industry cost basis of around $2 billion.
In reality, we know that costs are a mix of fixed and variable. So perhaps the right industry cost is somewhere in between. Ironically, a study we did a while ago looking at the competitive exchange market, pins the industrywide revenues, before dark pool revenues, (you guessed it) somewhere in between.
The data also shows that market forces lead most exchanges to competitively price data and colocation and trading, with the revenues they get from each of the byproducts of having tickers to trade split somewhat evenly.
Chart 3: Estimated all in costs of different venues
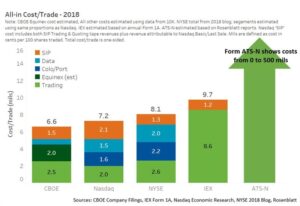
In the above chart we’ve also added dark pool costs-to-trade based on new form ATS-N disclosures. ATS costs range from “free” to around 500 mils. That’s mostly much higher than the cost of trading on exchanges, even though they argue it’s more efficient to avoid paying exchanges trade fees.
Importantly (to this debate), the ATS filings look to have “no link to costs.” That just highlights how hard it is for accountants to cost out byproducts on a platform accurately. This is especially true when fixed commission revenues pay for a combination of fixed and variable costs of running dark pools, such as buying tech for algorithms and employing human traders and compliance personnel.
Competition at all costs won’t make the market efficient
There are definitely economic distortions in the current system, many that encourage fragmentation of liquidity and trading. In a competitive market, basing payments on cost supports fragmentation and will likely end up costing the industry more.
The market could be more efficient if the right balance between complexity, fragmentation and competition could be struck. Although it seems we’ve done about as much work as bond markets in quantifying what the optimal economic incentives and market-wide fixed costs for good data really are.