


By Phil Mackintosh, Chief Economist, Nasdaq
We recently looked at the LULD rules and found that exchange-traded funds (ETFs) trigger LULD bands much less frequently than stocks. That makes sense, given that ETFs are a portfolio of stocks, representing a more diversified and theoretically less risky exposure. In fact, data even showed how ETFs had much lower volatility than most stocks within the ETF.
Given that, we mused about whether it might make sense to consider tighter LULD bands for ETFs than stocks. Today we look at how that might work in practice.
We use real ETF price returns in 2020 and 2021 and compare them to modeled “half bands.” We also exclude the four MWCB dates as they were clearly unusual days, although around 80% of all ETF LULDs still came from 2020, with the majority in March during the Covid selloff.
First, though, let’s understand how LULD bands get calculated.
The math of LULD
Unlike MWCB bands, which are based on prior night’s close and don’t change all day, LULD bands are calculated over a rolling five-minute window throughout the day. Basically, LULD uses a simple arithmetic average trade price, recalculated every 30 seconds for the prior five minutes.
Guardrails are then set at the LULD price ±5% for Tier 1 stocks and ±10% for Tier 2 stocks. Although the guardrails only move if the LULD reference price has moved more than 1% in either direction.
Importantly, a trade in the opening auction sets the initial LULD reference price. That allows the market to price in overnight news without triggering a LULD halt. For example, if a stock had positive earnings or M&A news overnight, the opening auction could be more than 20% above the previous close without triggering the first halt. However, if a stock has no opening auction trade, the LULD bands will use the prior day’s closing price to establish the initial bands.
As we head into the close, volatility can also sometimes increase, especially if a trader needs to finish an order before overnight news hits the tape. To allow for that, without halting those trades, Tier 1 stocks (which have the tightest bands) switch to “double-wide” bands starting at 3:35 p.m. Tier 2 stocks don’t’ modify, so they keep their original bands.
In Chart 1 below, you can see the LULDs for the QQQ ETF for a whole day (dark blue lines) compared to trades (yellow dots) and quotes (green lines). We also show how the open (light purple dot) sets the LULD bands well above the prior night’s close (small dark purple dot).
Chart 1: Bands track traded prices during the day, resetting only when the LULD moves 1% up or down (Note that the pale colors represent “half bands,” which we discuss below)
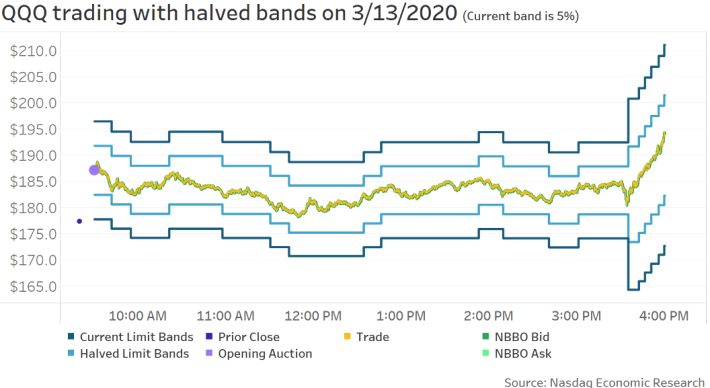
One of the benefits of rolling average trade price used by LULD bands is that they allow the market to continue trading if the price movements in the stock are “orderly” – representative of valid price discovery or news-driven returns. For example, if a stock is trading actively, its price can fall more than 5% in the five-minute window, as the new trades will reset the band lower before the five minutes is up. That, in turn, reduces unnecessary halts and maintains liquidity in the market.
How LULDs protect investors
If a stock starts to rally quicker than the reference price can be reset, the security enters a so-called “Limit State” where the bid (in this instance) is priced to the upper “LULD limit.” If that order is not offset within 15 seconds, the stock halts for a minimum of 5 minutes to allow liquidity providers time to participate in a reopening auction.
That is designed to protect investors from executing at “bad” prices, especially if a large market order arrives when spreads are wide or depth is thin. For example:
- If the LULD for a Tier 2 stock is $10, the upper and lower bands will be ±10%, let’s say $9 – $11, to keep the math simple.
- If the spread in the market is wider, say bid $9 – offer $12, a market BUY would NOT trade at $12, but would instead cause a limit state, where the market buy gets repriced to $11 and posted to the book.
- If the NBBO doesn’t fall back inside the LULD bands (a seller hits the $11 bid) within the 15 second time limit, the stock will enter a five-minute halt, triggering a reopen auction on the primary exchange – which is also used to establish new LULD bands for continuous trading.
The result, in theory, stops a market order or aggressive limit order from trading at a clearly erroneous price.
How do LULDs work for ETFs
ETFs are allocated into two groups based on their liquidity – where the bands for Tier 2 (less liquid) ETFs are double the bands for Tier 1 ETFs. Levered ETFs have bands that are increased by the leverage multiple.
We’ve already seen that most ETFs are much less volatile than the underlying stocks in their portfolios, suggesting that perhaps we should be able to set tighter LULD bands for ETFs.
The data in Chart 2 also shows that Tier 2 ETFs (blue dots) actually have around the same volatility distribution as Tier 1 ETFs (orange dots). In fact, the median volatility (where the grey boxes change color below) for Tier 2 ETFs is actually lower. This suggests that to improve investor protections, LULD bands might not need to distinguish between Tier 1 and Tier 2.
Chart 2: The typical daily range of prices for each ETF show most Tier 2 ETFs are actually less volatile than Tier 1
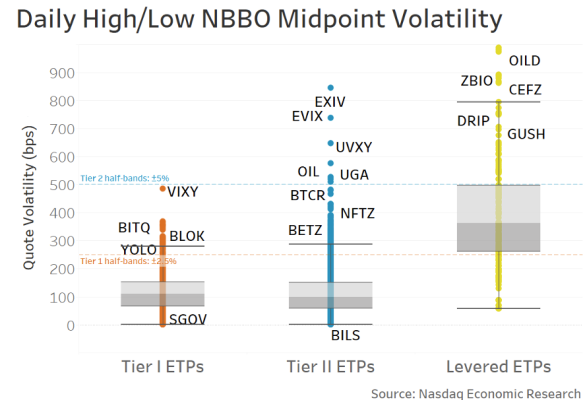
More importantly, even “half-sized LULD bands” (dashed lines) are outside the average whole-day range of prices for most ETFs in each tier – meaning the current bands are all well outside average daily price ranges for each ETF.
Tier 2 ETFs trade less, but they still quote tight and consistently around NAV
ETFs are also different to single stocks because they have a more verifiable “fair value” and mostly have active market makers who can arbitrage dislocations between ETF and stock prices. That makes large dislocations less likely to persist for ETFs provided underlying stocks are actively trading, and creation and redemption mechanisms are available.
Looking at ETF data shows that the majority of ETFs see prices quoted competitively and consistently throughout the day – tightly around the underlying net asset value – even if there are no trades.
We can see this from the data in Chart 5:
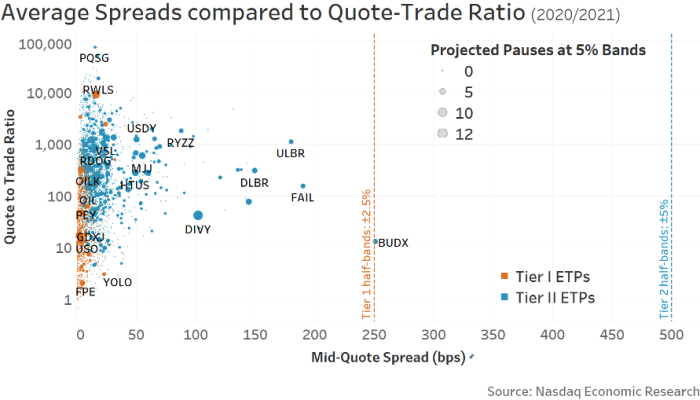
- The way all the dots are on the left of the chart shows spreads in ETFs are well inside even half the current LULD band levels.
- Although Tier 2 ETFs (blue dots) tend to have wider spreads, their spreads are almost all inside half of a Tier 1 LULD band.
- Tier 2 ETFs also have much higher quote-to-trade ratios (higher on the vertical axis). High quote-to-trade ratios indicate that even when no investors need liquidity in those names, market makers are actively quoting all the ETFs at prices in sync with underlying assets. In fact, the lack of trades is a testament to how well ETF quotes track fair value, as if prices fell out of sync, there would be arbitrage trades.
Chart 3: The reason is many ETFs are quoted very actively, with tight spreads (but just don’t trade)
ETFs are different, but more research is required
Clearly, ETFs are different. They are more diversified than single stocks and able to be arbitraged when prices do dislocate.
The data seems to indicate that ETFs LULD bands might not need to distinguish between Tier 1 and Tier 2 stocks, even though Tier 2 ETFs have slightly wider spreads. A more interesting question is could ETF bands be narrower too? But that is a question for another day.