


When it comes to spoofing, the strategies, methods, and frequency constantly evolve, but at its core, spoofing is still the use of false orders to create a misleading impression of buying or selling pressure.
By Alan Jukes, Nasdaq
Spoofing is not a new behavior, yet continues to be at the forefront of high profile enforcement actions.
When it comes to spoofing, the more we see things change, the more we see certain things stay the same. The strategies, methods and frequency are constantly evolving, but at its core, spoofing is still the use of false orders to create a misleading impression of buying or selling pressure.

The spoofing-related prosecutions that have taken place across the globe over the last twelve months demonstrate that while spoofing is a consistent behavior relied upon by market manipulators, the tactics used are constantly changing.
Unlike many of the high-profile spoofing prosecutions from 3-5 years ago (e.g. Michael Coscia/Panther Energy), recent examples do not appear to be a case of rampant and constant spoofing, rather instances where activity is sporadic and not intense. In many cases, the activity is carried out once or twice a day, in between lengthy periods of trading with no apparent manipulative intent.
For those spoofing cases over the last 12 months where sufficient details of the scenario have been made public, well-designed spoofing alerts with appropriate parameter settings should have been able to detect the nefarious behavior.
Even though the strategy and intensity of these spoofing scenarios may have changed, market participants can be confident that with the proper tools, these patterns of activity should be detected.
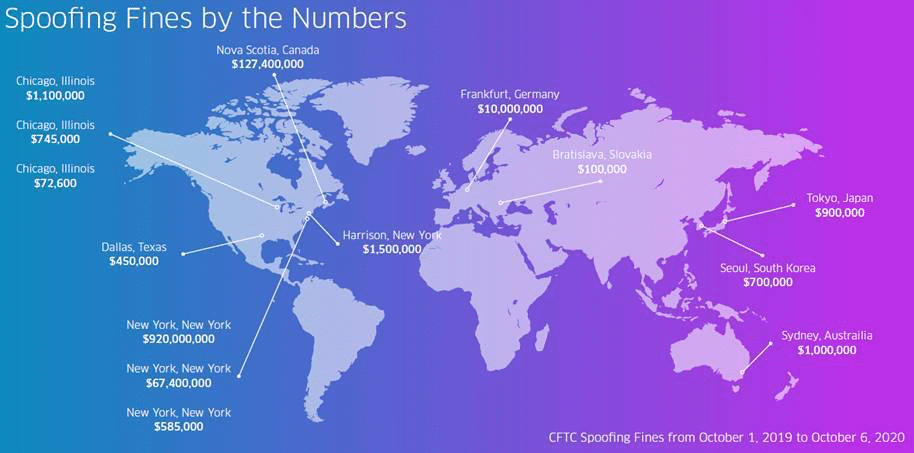
Information included in the graphic above is based on public information published by the Commodities Futures Trading Commission (CFTC) in 2019 and 2020. For more information, visit cftc.gov
One of the key challenges facing compliance analysts in monitoring for spoofing is being able to disseminate potentially millions of rows of data into a meaningful story.
Understanding complex alert scenarios in order to make informed decisions regarding the escalation or closure of alerts within a limited timeframe can be a very challenging process. In the case of spoofing alerts, the analyst needs as much information as possible with which to make such decisions, and it can be very difficult to adequately train analysts to be able to identify spoofing behavior simply by reviewing the raw data. Therefore, we need to be able to employ as many methods and techniques as possible to identify spoofing. These should take the form of both activity-specific alerts’ as well as strong visual identifiers to provide a high-level overview.
In my previous role as a surveillance analyst at a global derivatives exchange, I worked on developing a new ‘spoofing’ alert in Nasdaq’s trade surveillance application. During its development, a particular trader was generating several hundred alerts per day in the highly liquid Crude Oil Futures contract.
As an ex pit trader, I am familiar with spoofing as a practice, and was quickly able to ‘see’ the behavior in the raw data. The behavior was prolonged, repeated and significant, but the raw dataset comprised several million rows of data. I needed to convey this information to senior management in a way that demonstrated the pattern of behavior. I started working on a way to visualize the data, if I could ‘see’ what spoofing looked like, it might be possible to identify the ‘signature’ of spoofing.
After building an order book depth visualization tool myself, I could immediately see a pattern. The pattern was regular and consistent, and because it repeated itself every time a ‘spoofing’ event took place, it could be considered a ‘signature’. It was this ‘Depth’ visualization that I then developed when I joined Nasdaq, which now forms part of our standard trade surveillance package.
By utilizing the alert output, along with this visualization, analysts are able to get a clear understanding of the trading strategy and the impact of that activity on the order book. Subsequently, this analysis can be used as evidence to demonstrate the intent behind the trader’s actions and to provide a visual representation of the behaviour using the Depth view.
Having the ability to ‘see’ into the order book in this way is key to understanding a trader’s behavior. Simply looking at transaction data doesn’t easily allow the user to identify repeated patterns in the way Depth does. Depth can be used to provide evidence to demonstrate the intent behind the trader’s actions, to provide a visual representation of the behavior, and to visually show any patterns.
One of the biggest challenges firms face is hiring analysts with sufficient experience in reviewing spoofing-type behavior who are able to properly identify when it is occurring. There might be alerts that are being generated, but because firms get so many alerts, it can be difficult to identify the specific behavior, especially when looking for patterns over time.
It is critical that firms have the ability to identify spoofing, and also explain other behaviors that may have fired alerts, such as market making. It is possible for an analyst to miss something in the data, but when presented with additional visual cues, a determination can be more effectively obtained.
Alan Jukes is Principal Product Manager for Nasdaq Surveillance, working primarily on detection and investigation products.