


Who would have thought that a year with a recession caused by a pandemic would also have one of the strongest IPO markets in decades? But it did.
Data shows that IPOs generally fall in the months of dramatic selloffs but usually recover once volatility normalizes. Last year followed that trend again, with a strong V-shaped recovery in the IPO market that made 2020 a record year for IPOs.
Total new listings at 1999 levels
Although the IPO market stalled in March as the broader economy shut down, access to capital remained important. In fact, during the turmoil, Moderna raised an additional $1.34 billion to help accelerate important vaccine research.
As the economy started to recover, IPO activity also picked up quickly. We finished 2020 with 471 IPOs, a level not seen since 1999, according to data from Professor Jay Ritter.
Chart 1: Count of listings over time by listing venue
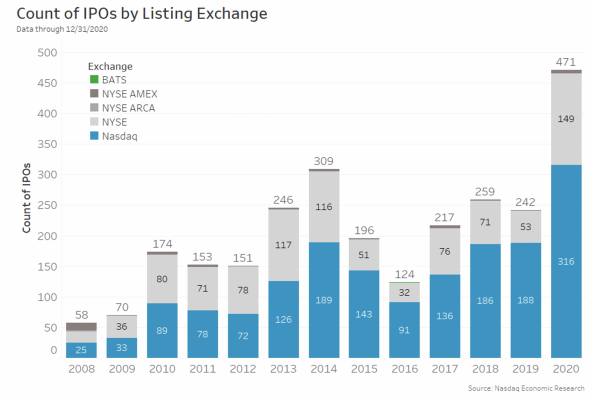
Once again, Nasdaq led U.S. exchanges with 316 IPOs, representing an 83% win rate for operating companies, and 52% of all capital raised.
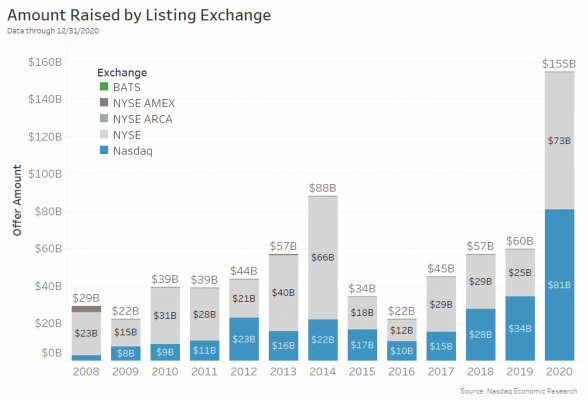
Overall, IPOs raised $155 billion in 2020, almost double the next best level since the credit crisis, where $88 billion was raised in 2014 across 309 listings.
With the reduction in buybacks, Bloomberg estimates 2020 was the first year with an expansion in equity supply in a decade. However, with trading of $479 billion in corporate stocks every day, that increase in supply wasn’t enough to stop prices from rising.
Chart 2: Capital raised over time by listing venue
Some sectors are hotter than others
Given what an unusual year 2020 was, it is interesting to see what industries needed to raise capital.
Not surprisingly, the data shows that healthcare companies accounted for almost one-third of all new capital raised by companies. We also saw a higher proportion of capital raised by consumer companies than any year since 2010, adding to around a quarter of all capital raised.
Somewhat surprisingly, the allocation of capital raised by tech was down significantly from recent years. Our records also show there were no IPOs in the energy sector despite a late rally in green energy ETFs as the election neared, fueled by Democratic proposals to invest in that sector.
Chart 3: Sectors raising capital vs. broad market representation
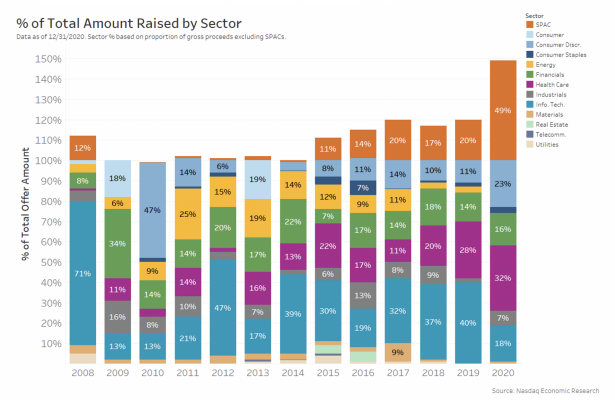
The other trend that clearly stands out is the increase in Special Purpose Acquisition Companies or “SPACs.” SPACs are only shell companies. They raise capital in order to search for a private company that it will bring public in the future—hence us showing them above the 100% raised line.
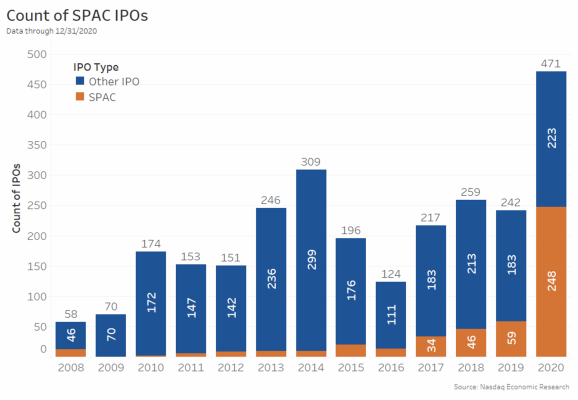
Although SPACs have been growing over the past five years, last year they represented nearly 50% of all capital raised by operating companies, with more than $70 billion in proceeds raised. Because SPACs are typically smaller than operating companies, they accounted for more than half of all new listings in 2020.
Chart 4: Types of IPOs over time
Alternate ways to list: SPACs and direct listings
SPACs and direct listings were both popular last year. They both represent ways to bridge the gap between private equity and a traditional IPO, and neither requires an extensive roadshow.
With so much of the country working from home, and experts advising against travel, the growth in SPACs and direct listings may partly represent a practical solution to COVID-19.
This has come despite SEC changes that loosened accredited investor rules, allowing more investors to buy private companies. In contrast, being listed on public exchanges, SPACs allow anyone with a brokerage account to benefit from emerging companies, with SPAC managers bringing private companies public and realizing the liquidity premium.
IPOs also performed strongly this year
Not only was it a strong year for capital raising, but IPOs also performed unusually well.
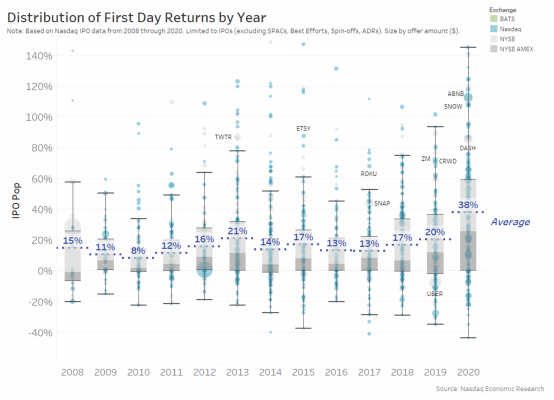
Over the past 10 years, an average of 24% of IPOs have negative first day returns. However, this year only 21.5% of IPOs closed their first day of trading below the offer price, the price paid by early investors allocated stock the night before the IPO started trading. That’s also evident from the average day-one return of 38%, well over the normal IPO premium.
Chart 5: The majority of IPOs had good first-day returns
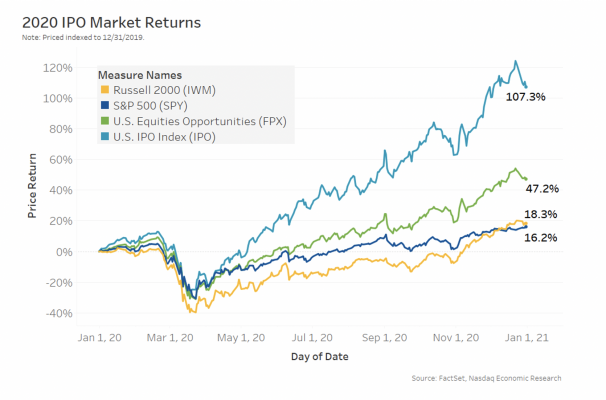
It wasn’t just day-one returns that were strong this year. If we look at IPO ETFs, they mostly acquire IPO companies after they have started trading. So they don’t capture the liquidity premium from listing. Despite that, they also outperformed the market. The Renaissance IPO ETF (IPO) ended the year up +107%, while First Trust’s U.S. Equities Opportunities ETF (FPX) rallied +47% (Chart 6). Even after accounting for the volatility in their underlying indexes, the risk-return ratio of both IPO indexes was better than the broader market.
Chart 6: IPO ETFs outperformed the market in 2020
An unexpected year on many levels
Despite the coronavirus pandemic, 2020 was an unexpectedly strong year for bringing companies to market. Because of COVID, it seems the attraction of alternate, “low contact” ways to bring private companies public also thrived.
The strength of U.S. listed markets is good news for U.S. investors, most of whom can’t participate in the early-stage gains of private companies. Not all countries had been so lucky in 2020, so this also reflects how attractive U.S. markets remain as a place to raise capital, as well as how the U.S. economy is able to adjust quickly to find opportunities, even in the midst of a pandemic.