


By NYSE
We recently discussed the ways in which exchanges can compete for retail order flow, including price improvement opportunities via their Retail Price Improvement (RLP) programs. Below we share additional details of RLP activity, using the last week in January as a case study for RLP activity in active stocks with substantial off-exchange trading interest. We also highlight the overall depth of the NYSE Group RLP program.
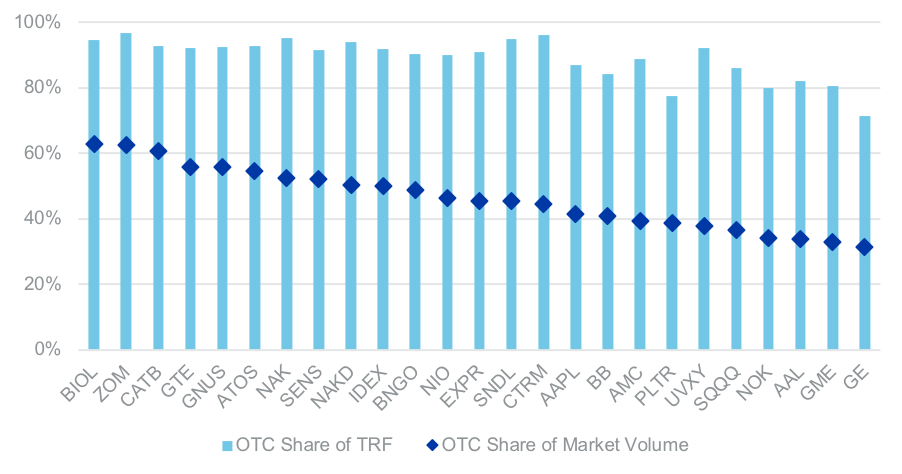
Most Active OTC Stocks, Jan 25-29
What Happened Off Exchange
The extremely high volatility and volume in several individual stocks contributed to record market volume levels. While retail activity contributed to these trends, overall volume traded off exchange was below average (44% for the week vs 47% for 2021 YTD). The most active securities for the week were less likely to be institutionally held and therefore off exchange activity was heavily skewed towards OTC venues rather than ATSs. In the high-volume names shown, OTC volumes represented between 71% and 97% of total off-exchange volume during the week. OTC share of consolidated volume for the individual stocks ranged as high 63%. Overall, OTC share was 44% of consolidated volume, and 90% of off-exchange volume for the top 25 stocks.
What Happened On Exchange
NYSE Group’s RLP programs offer marketable retail orders price improvement opportunities on exchange. One key feature of the on-exchange programs is that they publish indicators on market data feeds indicating when there is liquidity on the buy-side, sell-side, or concurrently on both sides, increasing the likelihood of a fill.
Retail price improvement orders were available, on average, 21% of the day on either the buy, sell or both sides, for the 25 securities noted above . NYSE RLP programs maintained retail price improvement (RPI) liquidity nearly 100% of the time in Nasdaq-listed SQQQ (ProShares UltraPro Short QQQ) ETP, including liquidity inside the quote more than 64% on both the buy side and sell side. Four additional stocks averaged RPI at least half the time. Table 1 below ranks the ten highest time with RPI liquidity from the Top 25 OTC names.
NYSE’s RLP programs averaged being on the bid 7.6% of the time, sell 6.6% of the time and both 7.1% of the time (excludes time on the bid or offer). Adding this up, RLP had an order inside the quote on one or both sides on average 21.3% of the time. This compares favorably with inverted venues, which had lit liquidity at both the NBB and NBO on average just 7.9% of the time, at the bid 15.7% and the offer 19.5%.
Table 1: Time With Retail Price Improvement Liquidity
| Symbol | Time on Bid | Time on Offer | Time Both | Total |
| SQQQ | 18.7% | 16.7% | 64.3% | 99.7% |
| GE | 19.4% | 22.4% | 55.7% | 97.6% |
| UVXY | 30.7% | 28.2% | 64.3% | 30.5% |
| NOK | 36.6% | 20.7% | 8.7% | 66.0% |
| AAL | 17.0% | 29.7% | 9.3% | 56.0% |
| AMC | 15.7% | 13.4% | 8.0% | 37.0% |
| EXPR | 14.5% | 9.0% | 0.5% | 24.0% |
| BB | 10.4% | 6.8% | 0.6% | 17.8% |
| AAPL | 5.6% | 3.2% | 0.4% | 9.2% |
| GNUS | 4.5% | 3.4% | 0.0% | 7.9% |
The top 25 securities included several low-priced stocks. This resulted in an average retail liquidity taking order size for those equities of 686 shares, with 82% of all orders 500 shares or less. Volume-weighted average price improvement was three basis points but ranged as high as 26.5bps . Importantly, nearly 20% of executed volume matched against non-RPI orders. This includes mid-point liquidity provision, as well as other non-displayed orders priced inside the NBBO.
Table 2 below shows summary statistics for the program for the week of January 25 – 29, both for the top 25 FINRA OTC securities, as well as the program overall excluding the top 25 stocks. The top 25 issues represented 26.5% of shares executed in the program that week. The higher share of volume executing against RPI orders in the top 25, coupled with fewer securities impacted by the extremes of the high-volume stocks resulted in overall lower price improvement for stocks out of the top 25. However, the program still achieved an impressive 0.74 EQ ratio and offered opportunity for both liquidity takers and providers.
Table 2: Summary Statistics
| Top 25 | All Other | |
| Effective/Quoted Ratio | 0.66 | 0.74 |
| Average Order Size (shares) | 686 | 558 |
| % of Orders <= 500 shares | 82.3% | 83.4% |
| Effective Spread (bps) | 8.84 | 8.55% |
| Price Improvement (bps) | 3.00 | 1.66 |
| % Volume Executed vs. RPI Orders | 81.46% | 90.04% |
The Bigger Picture
While it is interesting to write about recently hyper-active stocks, you can access retail price improvement liquidity in far more securities. NYSE’s RLP programs provide RPI liquidity more than three times as often, on both sides of the market as Nasdaq’s and CBOE’s programs (11.3% versus 3.2% and 3.4% respectively) and maintains a strong advantage in time with either buy-only or sell-only liquidity.
Competing RLP Program Time With Liquidity
(Russell 1000 Stocks)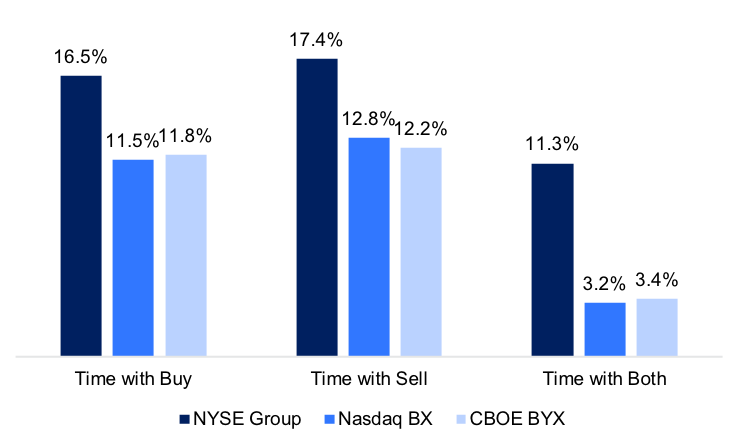
NYSE RLP also shines relative to competing programs beyond the Russell 1000 stocks. Overall, NYSE averaged 1,181 securities each day with at least 10% of the day with each of buy side only, sell side only and both sides RPI. This compares to just 747 securities for CBOE BYX and 436 for Nasdaq.
Next Steps: RLP Evaluation
These data elements will soon be available for all RLP activity at https://www.nyse.com/markets/liquidity-programs. We encourage market participants to evaluate this source of retail liquidity interaction as a way to counter the growing share of inaccessible liquidity, particularly in securities with lower levels of institutional holdings.
i NYSE-listed securities can use RLP on NYSE, while all other securities use NYSE Arca
ii 5 securities did not have any RLP liquidity
iii Among stocks that averaged at least 10,000 shares executed per day in the program