


Although most trading these days is electronic, different asset classes still trade in very different ways.
There are different types of market models
At each end of the spectrum are two different ways to facilitate liquidity:
- Dealer Markets: Where customers interact as known counterparties with an intermediary, usually a bank. Features of these markets include: bilateral trading and custom prices from quote requests, transactions often required ISDA’s and have credit exposure.
- Exchange Markets: A centralized marketplace that allows all customers to meet on a consistent single market, usually with anonymity. Features of these markets include: an all-to-all marketplace with a published best prices from continuous quotes and public trade reports, settlement streamlined and netted across venues.
Chart 1: Exchange markets and dealer markets are structured differently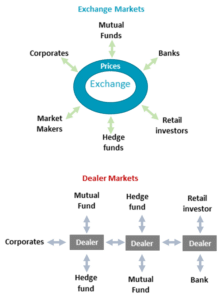
Source: Nasdaq Economic Research
The way each market works is very different for investors. Most exchange markets offer transparent and continuous valuations and price discovery. That includes actionable prices and guaranteed liquidity. Being a single anonymous marketplace has advantages too, as the signal from one participant is masked by the noise of all the others.
In contrast, dealer markets are characterized by “quote requests” and indications of interest. There is often no tape (or record of other peoples trades) and rarely a pre-trade quote. That makes it hard to know if you received a good price, regardless of how good your trader is.
Few markets operate at either end of the spectrum. Futures exchanges are probably closest to pure exchange markets, with a single venue per contract and centralized settlement and clearing. While credit and swap markets are usually closest to dealer markets, with ISDA agreements and often with non-fungible un-cleared exposures.
Stock markets are mostly exchange markets
Stock markets around the world are almost all closer to exchange-driven markets.
There are a lot of benefits to exchange market structure for investors. They typically treat all investors more equally. They are more transparent to all with a record of prices, which makes it harder to give small investors bad fills and easier for investors to value their portfolios and work out their next trades.
Listing exchanges themselves also offer a layer of supervision and quality control to the tickers that are listed. Combined, these traits tend to make them safer and more accessible for smaller investors. That’s why the $10 trillion U.S. equity mutual fund industry is typically limited to buying listed company shares, while regulators restrict ownership of private equity to accredited investors.
The capital looking to invest in U.S. stocks also lowers the costs of capital for corporates despite structural advantages that make private equity increasingly attractive.
Despite that, U.S. stock markets have some aspects of dealer markets. There is a robust “upstairs” market for retail and block trading, as well as customer tiering and bilateral trading that makes up over 40% of trading occurring off-exchange.
But the current rules still require those off-exchange fills be no worse than exchanges’ lit prices, and the SIP allows investors to prove that accurately after the fact. That’s why it’s important to keep lit quotes as inclusive and competitive as possible.
Although the SEC’s mission is to protect investors, their new NMS II proposals (also see here and here) are subtly pushing equities further along the spectrum to dealer markets. Adding to fragmentation and intermediation, allowing trade-throughs and likely devaluing the lit quote (whether intentionally or not) might make the quote itself less useful.
Today’s litany of markets are far from “equal” in the way that characterizes exchange markets. Lit quotes are already the liquidity of last resort, hit only if bilateral relationships won’t already fill orders. As that segmentation increases, providing quotes becomes less attractive and spreads widen. Just like global warming, there is a tipping point where investors acting individually end up harming themselves as a group.
Chart 2: Where different markets sit on the spectrum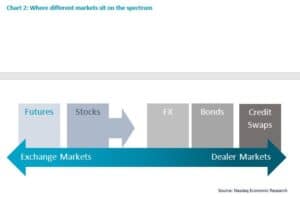
It’s hard to quantify costs of less-transparent bilateral markets with no data
Academics and practitioners, benefiting from the wealth of public data coming from exchange markets, have overwhelmingly overanalyzed the frictions and economics of stock markets. That’s resulted in pilots and proposals designed to target the latest small distortion in queue priority or toxicity. Ironically, what most of the findings show is that when markets are fragmented (by rebates or venues or tiers or speed) investors often lose, although usually only a fraction of a penny per trade.
In contrast, the small amounts of research on bonds indicates they are much more expensive to trade, even though there is little data to prove how good or bad executions were.
One study, done by Professor Larry Harris, looked at fills of retail investors buying corporate bonds. That study found that trade-throughs (worse executions than passed over trades available on an electronic market) occurred 43% of the time, and made dealers more than $500 million per year. That’s before the additional $700 million that dealers added to prices in their own mark-ups.
Given the much lower liquidity in corporate bonds than stocks, a similar lack of competitive lit and protected prices in equites would cost investors between around $5 billion and $12 billion each year.
Chart 3: Costs of no-quote data to investors is worse fills and no way to know it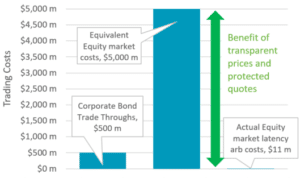
Source: Nasdaq Economic Research
The problem with less transparent markets is it took a professor with access to private data to calculate this. Investors in many dealer markets have no reliable prices to measure their executions (and sometimes their portfolios) against.
In contrast, the leading study on U.S. equity market trade throughs, which is adjusted for the geographic latency, estimated the actual costs associated with latency arbitrage is $11 million per year.
Chart 4: Costs of trading increases as market transparency and liquidity falls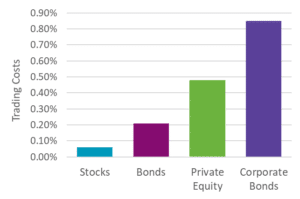
Source: Nasdaq Economic Research
The problem is not limited to bonds. A long list of regulatory fines in the past decade show that dealer and OTC markets, from Libor fixing, to FX and gold close marking, are harder for investors to police best execution, especially when prices themselves aren’t available. And of course dark pools have not been immune.
Amazingly the value of dealer-market fines dwarfs the estimated costs of less transparency in equity markets (above), which in turn dwarfs the ”few hundred million” dollars that the new NMS II rules seem designed to save. It puts the cost of equity market data in perspective!
COVID-Tested
Continuous exchange-driven markets have other benefits too. In stressed environments, they bring all traders together in a single marketplace with equal and actionable quotes. That’s especially important if some parties want to fade quotes or reduce risk. It also simplifies the search for prices and liquidity.
The recent COVID-19 selloff is a great test case. All reports point to bond markets seizing up again (as they did in 2009). Although spreads widened, bond index volatility stalled, indicating a lack of liquidity and price formation in the physical market. It was later revealed that companies drew-down around $300 billion in loan facilities just as asset managers saw record bond fund outflows totaling $218 billion in two weeks.
In fact, although bond ETFs traded as a discount to their bond market indexes during March, those dislocations coincided with Treasury market yields spiking to around 10-times wider than normal. Given Treasuries are a “risk free” asset, this highlights more the failure of the underlying market more than the ETF market. During that time, the continuous exchange-driven stock market became a price discovery and liquidity source for investors. This is supported by the fact that bond ETFs sold off even though they saw muted net inflows.
Chart 5: ETF “dislocations” vs bond market spreads indicate the underlying market was not pricing effectively
The cost of worse price discovery is underestimated
As equity markets deal with free retail commissions and a shrinking institutional commission wallet, it’s easy to see U.S. data prices as a friction to be reduced.
But as this analysis shows, knowing the markets’ best prices could quite easily be worth the cost.
Other countries have been working to keep stock markets more open and equal. Canada has trade-at rules to stop free-riding off the public quotes of others, while Europe has dark pool caps that limit trading in dark pools to 8% of total trading.
Longer term, shifting U.S. markets from a “single protected NBBO” further toward dealer markets might not result in better prices for all investors. History shows the opposite is likely. Especially once investors don’t know what the best prices are.
The views represented in this commentary are those of its author and do not reflect the opinion of Traders Magazine, Markets Media Group or its staff. Traders Magazine welcomes reader feedback on this column and on all issues relevant to the institutional trading community.

