


As of 2024, the number of Commission-registered broker-dealers has declined by nearly 30% from 4,758 in 2010 to 3,341, signaling significant industry consolidation, according to a new report by the Securities and Exchange Commission’s Division of Economic and Risk Analysis (DERA).
The number of clearing/carrying firms declined from 247 in 2010 to 158 in 2024, while the number of other firms declined from 4,511 in 2010 to 3,183 in 2024, the report found.
The Broker-Dealer Activity in the United States report, written by Diana Knyazeva and Daniel Bresler, economists at the SEC DERA, provides information on registered broker-dealers and their activities over the period 2010-2024, including an analysis of the industry, the structure of activity of different types of broker-dealers, and the revenues and expenses of broker-dealers.
The report revealed that despite a 30% decrease in firm count, total broker-dealer assets expanded significantly—from under $4.7 trillion to approximately $6.4 trillion. The distribution of these assets, however, is far from uniform. Just 2% of broker-dealers now account for 94% of total assets, underscoring the degree to which the industry has become concentrated in the hands of a small group of large firms.
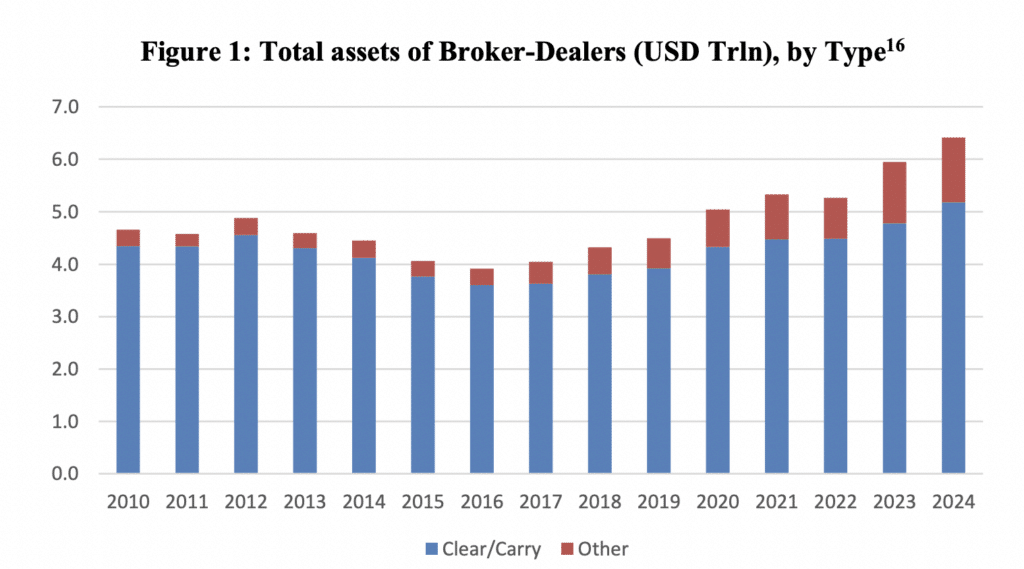
According to the findings, firms that clear and carry customer accounts—those responsible for both holding client assets and clearing trades—play an outsized role in this environment. Though they comprise only 5% of all broker-dealers by count, they hold more than 80% of industry assets, a figure that has slowly declined from 93% in 2010.
The data suggests that while large firms dominate the landscape, smaller broker-dealers continue to find niches outside the clearing and carrying space.
A similar consolidation trend is apparent in industry revenue streams. In 2010, commissions and the sale of investment company shares made up 18% and 8% of total revenues, respectively. By 2024, those shares had dropped to just 5% and 3%.
Meanwhile, account supervision, investment advisory, and administrative fees grew from 13% to 19% of total industry revenue, while income from securities trading increased from 5% to 12%. This evolution signals a clear shift away from transactional business models toward recurring, fee-based income strategies. Broker-dealers are increasingly behaving more like registered investment advisors, focusing on long-term client relationships and comprehensive service offerings.
This revenue shift coincides with notable changes in the expense structure of broker-dealers. Industry-wide profitability has remained largely stable, with total revenues consistently exceeding expenses throughout the sample period.
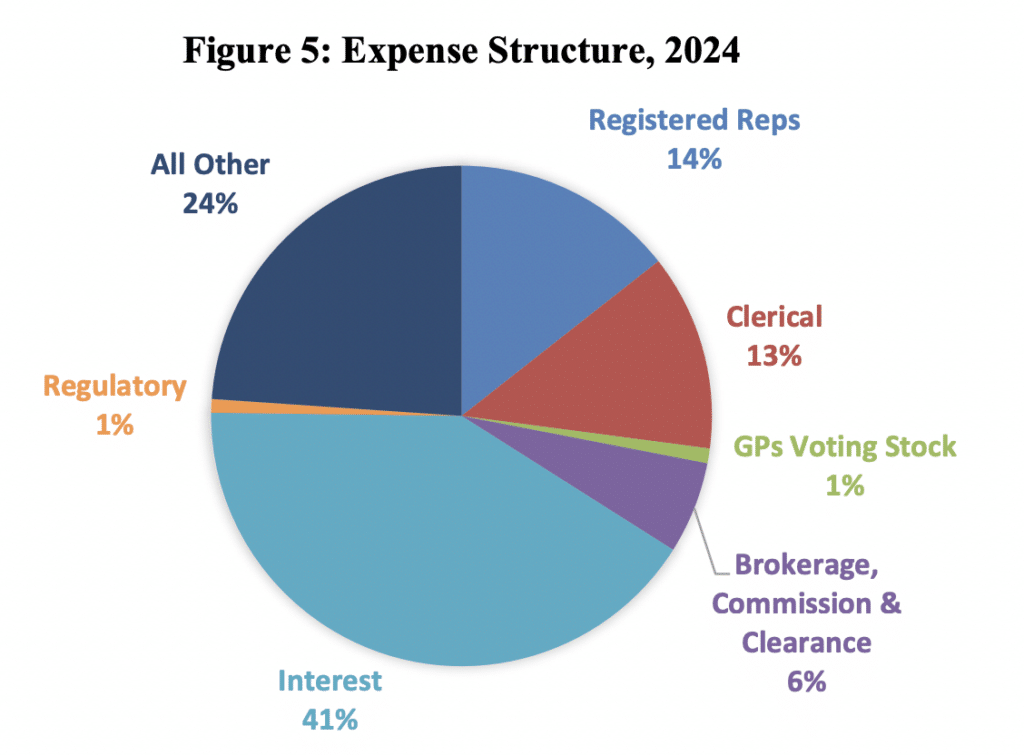
However, between 2022 and 2024, the industry saw a sharp increase in interest expenses, which reached 41% of total costs in 2024—driven by broader macroeconomic interest rate trends. Compensation-related expenses remained significant, with 14% of costs going to registered representatives and 13% to clerical and administrative staff.
Regulatory costs—while averaging just 0.88% of all expenses—disproportionately affect smaller firms. In 2024, firms in the lowest quintile of asset size spent an average of 5.5% of their assets on regulatory fees, compared to just 0.3% for the top quintile. These costs do not include litigation or compliance-related burdens, which may be more substantial for larger firms but are harder to quantify through FOCUS report data.
Employment trends further reinforce the pattern of consolidation. The largest 1% of broker-dealers employ 64% of all industry personnel, while the top 5% account for 84%. Most broker-dealers are small operations: the median firm had only 11 employees in 2024, and 75% had 40 or fewer. By contrast, clearing/carrying firms reported significantly larger headcounts, with the top 1% employing at least 29,900 people. While overall industry employment has grown modestly over the period, it has not kept pace with the expansion in total assets—indicating increased operational efficiency, automation, and scale advantages at the top end of the market.
The concentration of customer accounts mirrors the broader structural dynamics. The median broker-dealer that carried customer accounts reported just over 17,000 accounts in 2024. In contrast, the top 1% of such firms carried over 36 million accounts, reflecting the deep scale advantages enjoyed by the largest players in customer acquisition, digital platforms, and service infrastructure. This level of concentration has grown significantly in recent years, with the upper tail of the distribution gaining market share in both accounts and assets.
Geographically, the industry is anchored by a few dominant states. According to the findings, New York, California, Florida, Illinois, and Texas have the most broker-dealers by count, representing approximately 29%, 10%, 8%, 7%, and 6% of all registered broker-dealers with a principal place of business in the lower 48 states, respectively.
New York alone accounts for 76% of broker-dealer assets, despite housing just 29% of firms with the next 4 largest states being Illinois, Florida, Connecticut, and Texas accounting for approximately 5%, 4%, 4%, and 3% respectively. This suggests that while broker-dealer activity is geographically dispersed, financial power remains tightly clustered in a handful of metropolitan centers, particularly in Manhattan’s financial core.