


Consider this: back in May 2008 astronomers spotted a supernova or exploding star. However, it turned out this star was 88 million light years from Earth. That means the explosion happened 88 million years ago, well before humans roamed Earth, even though from our perspective it “looked” like it just happened.
The same thing happens with trading, although on a much smaller scale.
Think of it as Einstein’s Theory of Special Relativity applied to trading, because what the market actually looks like depends on your position in space. That also makes speeding up the SIP, and protecting speed-bumped quotes, especially difficult.
What is geographic latency?
Understanding today’s modern electronic markets requires an understanding of physics and geography.
Let’s start with the geography.
Recall from our earlier post that trading of all tickers can happen at any market place. In fact there are three major locations that stocks trade (Chart 1):
- Carteret: is where Nasdaq’s market operates from. This is also where the UTP SIP is located, (National Best Bid and Offer [NBBO] for Tape C) which aggregates all trades and quotes in Nasdaq listed stocks regardless where they trade.
- Mahwah: is where NYSE’s market operates from. This is also where the CTA SIP is located (NBBO for Tape A & B), which aggregates all trades and quotes in NYSE and regional listings regardless where they trade.
- Secaucus area: Cboe, IEX and many dark pools operate roughly in the middle.
Although the speed of light is fast, it’s not instantaneous (as the supernova example above proves). The time it takes to send messages from one venue to another creates unavoidable “geographic latency.”
It’s also fair to say that the more fragmented the market becomes, the more geographic latency matters.
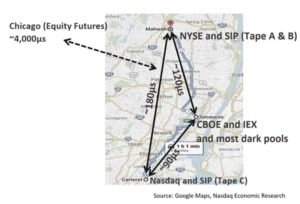
Chart 1: Message transit time between venues at the speed of light
Note that for simplicity, this post assumes there is no latency caused by network equipment (e.g. switches, radios, etc.) or cabling within the data centers. Ironically, that assumption makes it seem that all participants are operating at the exact same speeds. In reality, participants will never be at the exact same speeds. Regardless of how data is transmitted, different hardware and software choices will affect trading speeds.
Two wrinkles in time
Now let’s talk about physics.
Even at the speed of light, it takes at least
- 180 µs (microseconds) to cover the roughly 35 miles from NYSE to Nasdaq.
- 90 µs to go the 17 miles from Cboe to Nasdaq.
- 120 µs to travel from Cboe to NYSE.
This is actually fast. The time it takes futures quotes and trades to travel from Chicago back to New Jersey is closer to 4 milliseconds (4,000 µs).
That’s similar to the distances around Europe, which is also considering a consolidated tape. That additional latency makes it even harder to build a European Best Bid and Offer (EBBO) that is actually useful to professional investors, as will become obvious later.
The second wrinkle in time comes from the fact that glass has a higher refractive index than air.
That makes transmissions that travel through air faster. Microwave and laser travel at almost the speed of light. But there is a cost. They suffer from low bandwidth and data loss in bad weather.
In contrast, optic fiber is far more reliable and also has much more bandwidth. Whenever reliability and capacity is important, like for NBBO quotes and trades, data tends to travel around the market on optic fiber cables.
Interestingly, you can transmit more data per second on fiber, so if you have a lot of data to send, fiber will finish sending the data faster. But each byte moves around 50% slower, so if you have just one order to send, microwave will get to the destination first.
You can see from the times below, it takes quotes around 50% longer to travel in fiber:
- Carteret and Mahwah is closer to 280µ
- Secaucus and Carteret is closer to 135µ
What does this all mean?
Let’s consider how this works in real markets tracking a real order around the market. And if you need a refresher on the difference in microseconds (µs) and milliseconds (ms), see Time is Relative.
Say you are a buyer in AAPL and you want to lift all shares on the offer.
Let’s assume Nasdaq and NYSE Arca both have 100 shares for sale at $325.01, so the NBO = 200 for sale at $325.01 (Chart 2). Also, let’s say your broker is co-located in Carteret, where AAPL is also primary listed.
Here is what happens:
Chart 2: The market for AAPL at Time = Zero
Because the broker is based at Carteret, all trade messages are sent from there at the same time (circles).
There is almost no distance to the Nasdaq market, so almost no geographic latency to lift the Nasdaq quote. That also makes it is fast to put that trade and quote update onto the SIP.
However it will take at least 180µs for the buy order to get to NYSE.
Consequently, after 100 µs the:
- Best offer at Nasdaq should be the next higher priced order, say 300 @ $325.02.
- The SIP would also know this, so the NBO will now be just the 100 shares for sale at NYSE @ $325.01.
- The order to take shares at NYSE is around half way to Mahwah.
Chart 3: The market for AAPL at Time = 100 µs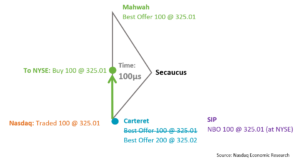
Fast forward to time = 200 µs. By now, a microwave route to NYSE should have arrived and traded. This is where spatial relatively comes in, as now:
- The best offer on NYSE is the next higher seller, say 300 shares for sale at NYSE @ $325.03.
- The best offer on Nasdaq remains the next higher seller, 200 shares for sale at NYSE @ $325.02.
- But the SIP still doesn’t know that the NYSE offer has traded, as the message about that trade has only just started its return journey (orange arrow in Chart 4). Consequently, the SIP would still be showing the 100 shares for sale at NYSE @ $325.01.
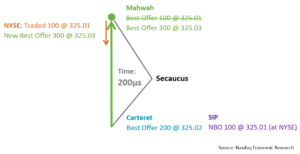
Chart 4: The market for AAPL at Time = 200 µs
Spatial relativity in the market
This is important. From above, after 200µs there are no sellers @ $325.01. The market has changed already. But not everyone will know yet (even with microwave price feeds).
However, even those who do know, can’t do a lot about it, as a trade message has to travel the same route as the fill messages. Both take time.
That’s also why latency arbitrage happens less than people think. Often the quotes that look attractive have already been traded. Just like the supernova. In fact, the leading U.S. study on latency arbitrage used microsecond timestamps but adjusted for the time would take to send orders to a quote that looks locked or crossed from a distance. That study found that those attractive quotes were in fact usually the afterglow of a now-executed trade, and not in fact an actionable quote. After accounting for this, the study found that latency arbitrage added to just $11.6 million per year in 2015.
Ironically, the only venues that are hurt by listening to the SIP when direct feeds exist are those pegging their customers to the exchanges’ prices without paying exchanges for those prices. Sometimes customers will get a fill, but at a price that was valid less than 1ms ago. Importantly, Reg ATS-N now shows investors which prices each venue uses, letting them decide.
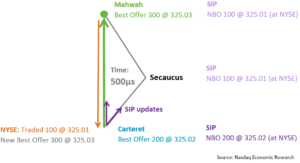
In 500 µs the SIP is updated
Once 500 µs has passed, all the information about the fills and new quotes from all exchanges should have arrived back at Carteret, even if the fills are returned on fiber (180 µs outbound + 280 µs return =460 µs).
Given the UTP SIP takes less than 20 µs more to update the NBBO, within 500 µs (half a millisecond) the whole market will have traded, and the NBBO at the SIP will be updated.
Chart 5: The market for AAPL at Time = 500 µs
There are three important takeaways from this:
- The majority of the “delay” on the SIP is due to geography, and waiting for a quote updated from distant markets to return to the SIP. Something that even affects direct feeds.
- The only thing that slows the SIP down are markets with additional geographic latency or artificial speed bumps. Ironically, speed bump markets benefit from slowing everyone else, while themselves operating at the speed of light.
- Even including geographic delays, at 500 µs the SIP is around 500 times faster than a human can blink. So the geographic delay has no impact on human traders or professionals watching a screen.
The SEC acknowledged as much years ago when they decided that anything faster that 1ms was “de minimis.” In short, the SIP works great for retail and any professionals watching a screen.
But given all the price discovery happens in less than 1ms, raises an interesting question.
How important is 1ms?
If you’re a computer, 1ms is material.
In fact, 180 µs is all the time a computer needs to buy all the shares on the offer across all New Jersey Markets (at least those without a speed bump).
Within 1ms, all price discovery has happened. We can show that by viewing the chain of events from above in a timeline (Chart 6):
- The market starts with two exchanges offered @ $325.01.
- As the buyer sends out their trade, liquidity on the offer is traded as orders reach the venues, at the speed of light.
- Within 1ms, calm returns to the quote, and liquidity providers wait patiently for another investor to cross the spread.
In fact we discussed how different investors will be makers and takers of liquidity throughout the day.
But more importantly, data shows that these milliseconds of activity includes 100% of price discovery and an astonishing 28% of liquidity, despite representing less than 0.1% of the day for a typical stock.
That’s because there are 23.4 million milliseconds in each trading day. On a typical day there are only around 35 million trades across the more than 8,000 NMS stocks. Because the SIPs are so close to the speed of light, most stocks are in the “gray zone” above for less than two seconds of the trading day.
Turns out, when you’re a computer, trading is a lot like fishing. The majority of milliseconds are spent waiting with no new information. But when an investor bites, your fills will happen quickly, and the last thing you need is for the fish to get away.
For some stocks, more than half of all liquidity happens on a price change
Of course, all stocks trade differently. In fact diving into ticker-level detail in Chart 7 shows:
- High priced large cap stocks (large blue circles) trade closer to 70% of their liquidity in these price change milliseconds.
- Only tick-constrained stocks (gray circles) typically see more liquidity trading without a price level change. Ironically, those stocks have the longest queues, adding to opportunity cost and spread costs when you trade.
Chart 7: SIPs now process the NBBO faster than matching engines can process trades and quotes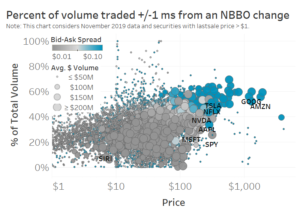
Source: Nasdaq Economic Research
Why does this matter?
This is an issue that affects many of the modern market structure debates. Often, the debates are missing how the physics and the geography impact in our markets.
It’s why data indicates latency arbitrage is mostly imagined.
Our NBBO is the envy of the rest of the fragmented world. It reconsolidates the fragmented market, and protects investor’s quotes and fills, simplifying the market and execution quality measurement.
Despite that, proposals to eliminate geographic latency will create fragmented SIPs too. Quotes will be different at the exact moments people are trading. In the current market, a short sell might be Reg SHO compliant, or not, depending where you sit. NBBOs won’t be national any more. Trade-troughs and crossed markets will be inevitable, permitted by the rules. Latency arbitrageurs will be lauded for “keeping markets in line”. All because we can’t wait less than 1ms for all quotes to update, a cumulated wait time of 2 seconds each day.
That implies the market no longer agrees 1ms is de minimis. On that basis, we should also unwind the complexities that interpretation permitted.
Pull at this thread all you like. The speed of light is the only thing that is truly the same for everyone.
The views represented in this commentary are those of its author and do not reflect the opinion of Traders Magazine, Markets Media Group or its staff. Traders Magazine welcomes reader feedback on this column and on all issues relevant to the institutional trading community.