


Although the market action recently seems crazy, and the selloff has been dramatic, markets are doing what markets do best. Providing liquidity and estimating future valuations.
Fastest bear market in history (but not the worst)
It is true this is the fastest bear market in history. As recently as Feb. 19, 2020, the S&P 500 was at all-time highs. Now the market is down nearly 30% from those levels.
That’s despite the economic data coming in this week, for retail sales and industrial production the U.S., is still showing how strong the economy was in February.
That shows that this market is not being driven by historic data, it is being driven by expected future data.
Chart 1: This bear market has been fast, but not unprecedented in its impact on prices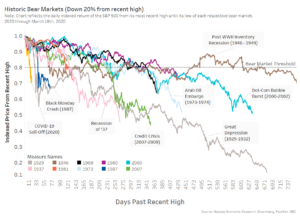
There is reason for optimism
Looking at the data, it wasn’t until late January that China started to see the growth of Coronavirus. Within three weeks their number of cases had swelled to around 60,000.
The good news is that once social distancing was put in place, the number of new cases slowed. In fact, in early March, just six weeks from the start, new Chinese cases were down to a trickle and an end was in sight.
Despite that, there remains a risk that a second wave of cases occurs if society returns to normal too quickly. In fact, a recent uptick in new cases in China were mostly from people returning from other countries.
Similarly, Korea saw its first cases mid-February. Right now, data show they too seem to have reduced the expansion of the disease, after just four weeks.
That’s important, because it seems to indicate that with strong quarantine procedures it is possible to control Coronavirus within four weeks and mostly stop the spread within six weeks.
Chart 2: The duration of a downturn is likely to be two months at best, even in China it took a week from infection to detection to recovery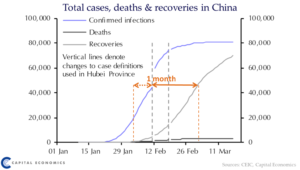
Why is that so bad for markets?
Which makes you wonder, how bad is this for markets?
One of the problems with quarantine is that many industries don’t experience a slowdown, like they would in a normal recession. Instead they experience a hard stop. Consider the bans this week on restaurants and travel between the U.S. and Europe. Not only will those businesses have no revenue to offset their costs, some will be forced to furlough workers to maintain operations. Those workers in turn will stop spending, which can start the feedback loop of a recession, where lower spending leads to lower profits and even more job losses.
An interesting article by a UC Berkeley Professor talks about how this “hard stop” is different to a classic recession. He forecasts GDP could slow by 5%. That is consistent with the slowdown seen in the Spanish Flu in 1918, another high-mortality contagious virus which lasted for over a year. With US GDP running at around $76 trillion, a yearlong slowdown of that magnitude could cost around $4 trillion.
In a similar prolonged slowdown, this hard-stop could be similar to the 2008 Credit Crisis, where companies and potentially whole industries need bailouts to survive.
Importantly though, in 2008 many banks suffered from bad management decisions which created a moral hazard for the government to lend support. As we know from 2008, bailouts that happened typically resulted in the loss of all or most of the equity in a company.
This time the government is shuttering businesses for the public good, so the moral hazard does not exist. In fact, there is also an economic case for the government to use public money to replace the lost demand, at least “make companies whole” on unavoidable operating costs, allowing them to keep staff under-employed and business ready to restart when travel restrictions are lifted.
That is where some of the rescue packages are now heading, with a $1.3 trillion stimulus plan in the U.S. and a $1 trillion rescue announced in Europe, in addition to country specific plans.
What’s the likely economic impact?
To understand the economic impact of quarantining a whole population let’s look again at China’s data.
Although the numbers are striking, data also shows China managed to commence recovery in around two months, so the impact on whole year GDP should be a fraction (although maybe one-sixth) of the second scenario above.
While China’s workers were quarantined, productivity and output literally fell off the charts. Industrial production fell around 20%, retail sales and fixed asset investments fell almost 30%. The official manufacturing PMI dropped from 50 to 35.7.
Chart 3: Social distancing slowed the Chinese economy dramatically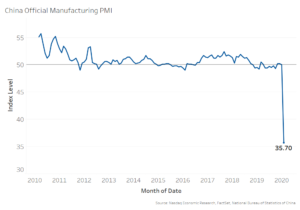
Today, around two months after this all started, people are starting to return to work. But data show the recovery might be slower than expected as people still avoid activities that risk of social contact and infection.
For example, data show coal consumption for power generation remains 30% below normal levels, road congestion is still 40% below normal levels. Other more “risky” activities that require physical proximity, like riding the subway remains down even more, around 66% below normal while attendance at movies has virtually stopped. Other data shows that passenger arrivals in Hong Kong and Thailand airports are around 10% of normal levels, and that in turn affects oil demand, restaurants, hotels and tourism even in unaffected locations.
Supply chains are also disrupted. Chinese ports have triple the normal number of containers waiting to be offloaded.
Chart 4: Two months after the onset of cases, the Chinese economy is still not back to full strength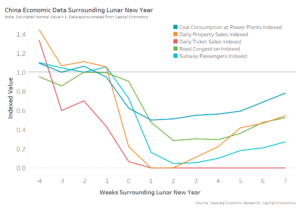
Even in China, the slowdown was sharp, and the recovery may not be “V-shaped.” Markets can use that as a data-point to revalue global assets.
Market swings are data driven
Right now we are in the growth phase of Coronavirus infection in western countries. The two very different outcomes above both appear possible, which creates uncertainty.
If the world can contain the virus quickly, as China and Korea did, the impact on workers and companies should be manageable, and the markets may well have overreacted.
If we fail, some models estimate we could experience losses of life and GDP closer to the magnitude seen 100 years ago in the Spanish Flu.
Forward PE’s look attractive for a period with such low interest rates, but they aren’t even close to the levels seen during the 2008 Credit Crisis or even the Sovereign Debt Crisis, where negative earnings and corporate solvency was a problem.
Chart 5: Forward PE’s look attractive for such low interest rates, but aren’t at 2008 Credit Crisis or Sovereign Debt Crisis levels where negative earnings and solvency was a problem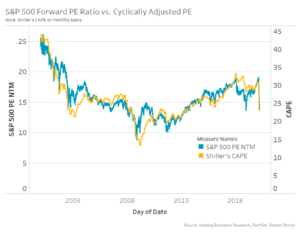
There is a big difference between these two outcomes. That’s why the market is moving so much.
Each piece of good news, from a slowing of new cases, to a vaccine, to government support make it more likely that companies will survive and business will get back to normal. That helps markets rally.
But bad news about increased spread of the disease, medical shortages and furloughs make it likely stock earnings will be lower for longer. That makes prices fall.
We need data on whether containment measures are helping. Given the incubation and contagion periods for this virus (Chart 2), we might take two or more weeks to see.
In the meantime, know that markets are already expecting a less than perfect result. So each piece of news (good and bad) should affect valuations accordingly. That’s one thing markets do well.

