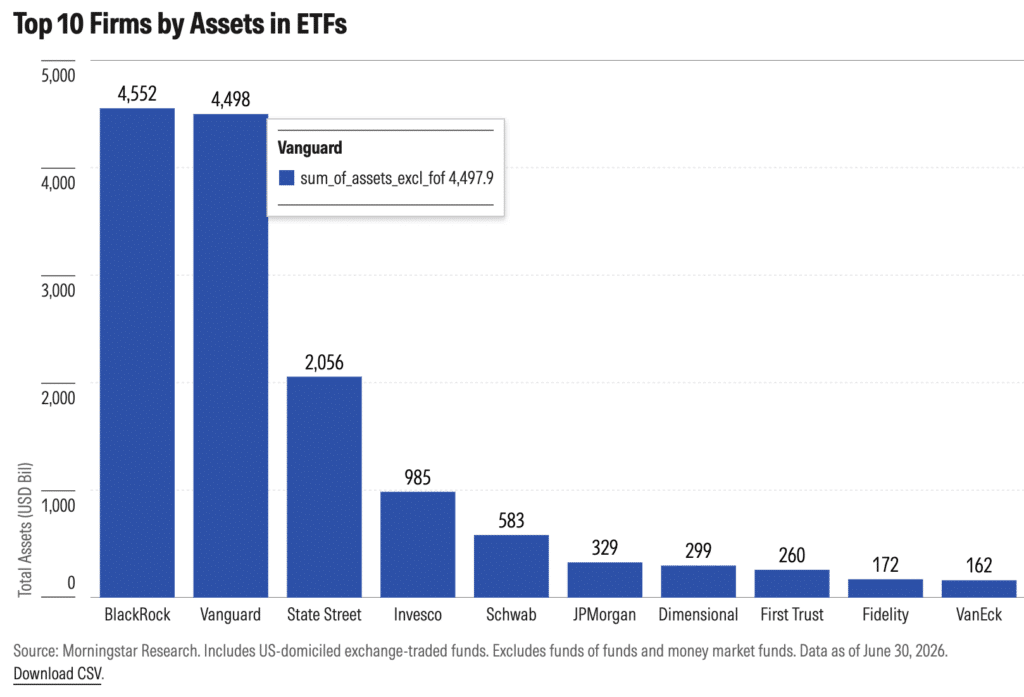
Vanguard is closing the gap with BlackRock for assets under management in U.S.-domiciled exchange-traded funds, according to Morningstar. The data provider said in a report that the gap between the two ETF issuers was nearly $200bn in assets in 2024 but this is the first year that it has shrunk to less than $100bn.
“Although these are still enormous sums of money, Vanguard briefly overtook BlackRock earlier this year before slipping back into second place by the end of June,” added Morningstar. “These two are likely to continue jockeying for first place depending on market moves, trading activity, and product development, considering the significant overlap between their lineups.”
Source: Morningstar
The U.S. ETF industry is highly concentrated with the three largest providers accounting for 70.6% of total assets under management, according to ETFGI, the independent research and consultancy firm.
ETFGI said in a report that at the end of July this year BlackRock’s iShares led the market with $4.53 trillion in assets and a 28.8% market share, followed by Vanguard with $4.51 trillion and a 28.7% share. State Street SPDR ETFs were in third place with $2.08 trillion and a 13.2% market share. The remaining 490 providers made-up less than 7% of total industry assets.
“Substantial inflows can be attributed to the top 20 ETFs by net new assets, which collectively gathered $111.10bn in July, the Vanguard S&P 500 ETF (VOO US) gathered $19.66bn alone,” added ETFGI.
Total assets of $15.74 trillion were invested in U.S ETFs at the end of July, below the record high of $15.78 trillion in June 2026, according to ETFGI. Year-to-date net inflows of $1.23 trillion until the end of July are the highest on record.
In active ETFs, Morningstar said Dimensional and JPMorgan stand out as two of the largest providers of active ETFs and both have converted mutual funds to ETFs in addition to launching new ETFs.
“JPMorgan Equity Premium Income ETF, JEPI, has garnered significant investor demand and ranks as the firm’s third largest fund as of June 2026,” added Morningstar. “Both Dimensional and JPMorgan have just over one-third of their fund AUM in ETFs.”
🚀 Active ETFs continue to break records.
📈Active ETF assets reached a new all-time high of US$2.59 trillion at the end of July 2026, while year-to-date net inflows climbed to a record US$590.46 billion, according to the latest @etfgi report.https://t.co/pqIVFdZU3w
Assets invested in global actively managed ETFs reached a record $2.59 trillion at the end of July 2026, according to ETFGI.
Dimensional and J.P. Morgan were the largest providers of actively managed ETFs globally at the end of July, said ETFGI. Each managed approximately $309bn in assets and hold an 11.9% share of the global active ETF market.
Consolidation
Morningstar highlighted that Vanguard, BlackRock, and Fidelity manage about half of assets under management in the U.S.
“Larger firms can spread costs across a broader asset base, supporting greater investment in technology, distribution, and operations while keeping fees low,” added Morningstar. “As such, industry consolidation remains a key theme.”
On 2 September 2026 CoinShares, the digital asset fund manager, announced that it has completed the acquisition of Bastion Asset Management Limited, which now operates as CoinShares Alternatives.
CoinShares said the acquisition means the group can provide investors with access to digital assets through both passive and actively managed strategies, spanning listed products, funds and managed accounts, within a single institutional platform.
JM Mognetti, CoinShares
Jean-Marie Mognetti, co-founder, president and chief executive of CoinShares, said in a statement that Bastion brings an experienced team, a differentiated systematic investment process and an established strategy with a strong track record and institutional investor base. Mognetti added: “By combining these capabilities with CoinShares’ infrastructure, market access and global distribution, we believe we have a strong platform from which to scale our alternatives business and capture the growing institutional demand for differentiated sources of return within digital assets.”
In August this year Goldman Sachs announced it has agreed to acquire NEOS Investments, a specialized provider of systematic options-based income ETFs, which managed $30bn in assets across 19 ETFs as of 30 June 2026, including a $1bn bitcoin premium income ETF. Goldman Sachs also closed the acquisition of another ETF issuer, Innovator Capital Management, which specializes in defined outcome funds in April this year.
The group said the combination of Goldman Sachs Asset Management, NEOS Investments and Innovator Capital Management creates a broad options-based ETF franchise. The combined platform will position it as a top eight active ETF provider with $80bn in active ETFs across a $130bn global ETF platform as of 30 June 2026, according to the bank.
David Solomon, Goldman Sachs
David Solomon, chairman and chief executive of Goldman Sachs, said in a statement: “As investor demand for active ETFs grows, NEOS’ disciplined investment approach is highly complementary to our capabilities across buffer, managed outcome and income strategies.”
T. Rowe Price also announced the acquisition of F/m Investments, a fixed-income manager with expertise in ETFs and $19bn in assets under management, in August this year.
Arif Husain, head, global fixed income and CIO, said in a statement: “F/m brings unique ETF product development capabilities that will complement T. Rowe Price’s active fixed income lineup across our intermediary, institutional, Rretirement, and wealth platforms.”
In the same month Victory Capital Holdings announced that it has agreed to acquire First Eagle Investments, an independent, privately held fund manager with approximately $222bn in assets under management as of 31 July 2026. Upon closing, the combined company is expected to have approximately $571bn in total client assets, positioning Victory Capital as one of the largest publicly traded traditional asset managers in the U.S.
David Brown, Victory Capital
David Brown, chairman and chief executive of Victory Capital, described the deal as “transformational” as First Eagle has a diversified product lineup spanning global multi-asset, equities, fixed income, and a scaled alternatives platform that includes CLOs and alternative credit.
“This transaction enriches Victory Capital’s talent pool, gives us additional scale to invest even more in our overall platform, and amplifies our distribution depth and breadth in the U.S., as well as outside the U.S. through our strategic partnership with Amundi,” added Brown. “It makes our company better, more competitive and more resilient through all market cycles.”
Morningstar highlighted that other upcoming combinations include Nuveen’s purchase of Schroders and Wellington Management’s acquisition of Hartford Funds.
Consultancy Oliver Wyman said in a report that one of the trends shaping asset management in 2026 is that fund managers with more than $2 trillion of assets under management have average margins of 45% and those with less than $500bn have average margins of 36%. However, those in the middle are caught in a “Valley of Death” with average margins of 26% as they are squeezed between scale and simplicity.
Oliver Wyman expects private equity and other activist sources of capital to increasingly start showing up in the asset management space. The report said: “The barbarians are moving toward asset managers’ gates.”
FINRA’s new intraday margin framework is intended to shift the focus from counting day trades to the risk investors carry during the trading day, according to FINRA officials.
The framework, which became effective June 4, 2026, eliminates the pattern day trader designation and $25,000 minimum equity requirement and aligns intraday margin requirements with those applied to end-of-day positions.
Speaking on the September 1 episode of FINRA Unscripted, Racquel Russell, Director of Capital Markets Policy and Head of the Office of Financial and Operational Risk Policy, and James Barry, Senior Director, Credit Regulation, discussed why FINRA changed the rules and what the new approach means for investors and member firms.
Racquel Russell
Russell said FINRA began a retrospective review of the day-trading rules in October 2024, seeking public feedback and gathering trading data from its members.
“What we found confirmed what we’ve been hearing for years, and that’s that the old rules, particularly the pattern day trader designation, as well as the $25,000 minimum equity requirement, were seen as unnecessarily restrictive in today’s markets. Those were designed for a different era,” Russell said.
Rather than make incremental changes, FINRA decided to replace the requirements with a framework that “ties a customer’s margin obligation directly to the actual market exposure that they carry at any given point during the trading day,” she said.
Barry said the previous framework developed against a backdrop of much higher trading costs. In the late 1990s, commissions were still around $16 per trade, and those costs could reduce the equity in accounts of investors who traded frequently.
He said a study conducted in the late 1990s determined that, based on commission rates at the time, an investor would need at least $15,000 to essentially break even with active trading. “Since we’re close to a zero-commission environment, the $25,000 didn’t really hold like a specific requirement in that case. That’s how we got comfortable with eliminating that aspect of it,” Barry said.
Under the new approach, Barry said maintenance margin requirements that apply to overnight or end-of-day positions are effectively maintained throughout the trading day. “The easiest way that I can describe the rule is it’s effectively ensuring that the maintenance margin requirements, as required by the rule for overnight positions or end-of-day positions, must be maintained throughout the day,” he said.
Barry said FINRA wanted to standardize the approach rather than maintain a separate set of margin requirements specifically for day trading. The framework also replaces day-trading buying power with an “intraday margin level,” or IML. Barry said the change shifts the calculation toward determining the margin required on an account at any given point during the trading day.
James Barry
The intraday margin level is the amount of equity in an account above the required margin, he said. If the IML becomes negative, it can result in a maintenance margin call at the end of the day, but it does not automatically force an intraday liquidation. Barry said the decision to liquidate an account during the day rests with the member firm.
Barry also described several consequences of the previous rules that emerged through FINRA’s discussions with investors. He said some investors with accounts below $25,000 told FINRA they would not place stop-loss orders after buying a security because a sale during the same day could count toward their day trades. “That’s where you start thinking, O.K., there’s some negative parts of the rule that weren’t particularly, I think, a desired outcome of the rule,” Barry said.
He also pointed to pin risk involving options exercise or assignment. Some customers would hold stock until the following day rather than sell it on the same day as an exercise because the transaction could otherwise count as a day trade, Barry said.
He said the previous rule also did not adequately capture newer products and strategies, including zero-days-to-expiration options and leveraged ETFs. “As I mentioned earlier, 0DTE had no margin requirements because they disappeared by the end of the day,” Barry said. “They were kind of invisible to the old rule. That invisibility is gone. So now there’s margin requirements associated with them as well.”
Another issue that surprised FINRA during its review was investors borrowing money to reach the $25,000 threshold, Barry said. He cited credit cards, home equity lines of credit and personal loans among the sources investors used. “We didn’t anticipate, I think, this part of the process occurring,” he said.
For member firms, Barry stressed that FINRA’s requirements establish a minimum: “FINRA’s margin rule is a minimum standard. It’s not the standard.”
Barry said firms are expected to set their own house margin requirements based on their credit judgment and understanding of customers’ trading activity. Firms can also liquidate an account if it enters a margin deficit during the trading day.
Member firms have until October 20, 2027, to fully migrate to the framework. Russell said firms will need to update their written policies and procedures as well as their technology. Barry said FINRA has also created 20 interpretations to help firms understand the rule and its calculations.
Russell said eliminating the $25,000 requirement and pattern day trader designation does not change the risks associated with frequent trading. “Frequent trading strategies are not for everyone. Buying on margin and shorting are strategies where you can lose more money than your original investment,” she said.
As policymakers and retirement plan sponsors explore expanding access to private markets within defined contribution and 401(k) plans, most of the conversation has centered on access, diversification, and the potential for stronger long-term returns.
A more fundamental question is emerging: does the private markets industry have the valuation, data, and governance infrastructure necessary to support millions of retirement savers?
The U.S. Department of Labor’s proposed safe harbor framework brings that question into sharper focus. By making valuation, benchmarking, and ongoing monitoring explicit factors in a prudent selection process, the proposal recognizes that expanding access to private markets is about more than investment selection. It is also about whether the operational infrastructure behind those investments is sufficiently transparent, consistent, and auditable for participant-directed retirement plans.
That distinction matters.
Institutional investors have long accepted that private assets operate differently from public markets. Pension funds, endowments, and sovereign wealth funds employ sophisticated investment teams that can interrogate valuation methodologies, negotiate reporting requirements, and scrutinize governance processes. Defined contribution plans have none of that machinery at the participant level. A 401(k) saver cannot audit a discount rate. Participants rely entirely on fiduciaries to ensure the information reflected in their retirement accounts is accurate, consistent, and defensible.
That shifts transparency from an operational consideration to a matter of participant protection. The industry’s next challenge is deploying the infrastructure that earns that trust.
The infrastructure gap
Much of today’s private markets ecosystem was built for a relatively small number of sophisticated institutional investors: manual valuation processes running on spreadsheets, fragmented data sources, and workflows designed for quarterly reporting. None of it was intended to operate at the scale or frequency participant-directed retirement plans require.
Three gaps demand attention.
First, scalability. Valuation processes designed to support dozens of institutional limited partners must now support daily net asset values flowing into potentially millions of participant accounts. Retailization is already pushing valuation frequency from quarterly to
monthly and on-demand; 401(k) inclusion accelerates that pressure. Meeting it requires a level of automation, governance, and operational resilience that spreadsheet-based processes cannot provide.
Second, auditability. The proposed safe harbor is fundamentally process-based. Fiduciaries will need confidence that every valuation can be reconstructed, with inputs, assumptions, and approvals documented in a complete audit trail. Manual quarterly processes typically lack the version control and data lineage that make reconstruction possible.
Third, governance, including independence. Valuation methodologies must be consistently applied, documented, and subject to oversight that is meaningfully separate from portfolio management. Changes to assumptions, comparable companies, or discount rates should be deliberate and traceable. Fiduciaries should also expect independent checks on manager-provided marks; in participant-directed plans, valuation should not rest solely with the manager whose compensation depends on it.
These are core elements of fiduciary risk management, not back-office improvements.
A sound framework that can go further
The proposed safe harbor establishes a strong foundation by focusing on the decision-making process rather than prescribing which asset classes fiduciaries may select. That asset-neutral approach gives plan sponsors appropriate flexibility while setting expectations across performance, fees, liquidity, valuation, benchmarking, and complexity.
As the Department reviews comments and moves toward a final rule, it could go further on valuation and governance. Clarifying what constitutes “adequate measures” through principles such as documentation, consistency, explainability, and auditability would give fiduciaries greater certainty and encourage common standards across the industry.
Explicitly recognizing established fair value frameworks — FASB ASC 820, IFRS 13, SEC Rule 2a-5, the IPEV Valuation Guidelines, and the International Valuation Standards (IVS) — would anchor the rule in practices the market already knows how to apply and audit, rather than leaving fiduciaries to interpret broad regulatory language on their own.
What fiduciaries should demand
The industry’s primary objective to date has been expanding access. The focus now needs to shift to operational readiness, and fiduciaries are well placed to drive it. Before allocating to private markets, plan sponsors and their advisers should ask hard questions of every manager and vehicle. Can each valuation be reconstructed from documented inputs and assumptions? Is the valuation process governed separately from portfolio management? Are marks subject to independent review? Can the process operate at daily NAV frequency without degrading rigor?
Managers who can answer yes will find fiduciaries receptive. Those who cannot will discover that in defined contribution plans, opacity is disqualifying.
Expanding private market access is as much a governance challenge as an investment one. Success in 401(k)s will depend on delivering returns, and equally on earning the confidence of fiduciaries, regulators, and retirement savers through valuation practices they can verify. Operational transparency is the foundation on which that trust will be built.
Laurent Van Hassel shared on LinkedIn that he’s starting a new position as Head of Trading at Dragonarch Partners LP, based in New York.
Laurent Van Hassel
Van Hassel brings more than 15 years of trading experience spanning global equities, futures, commodities, options, ETFs and foreign exchange.
Most recently, he served as Senior Trader at BHS Advisors, part of Brookfield Asset Management, where he was responsible for portfolio coverage and execution across several investment strategies, including generalist, alpha capture, short-alpha, technology, media and telecommunications, and healthcare.
During his time at Brookfield, Van Hassel also worked on expanding trading capabilities into Europe and Asia-Pacific, developing routing wheels and automated routing capabilities, and designing algorithms aimed at improving liquidity sourcing and reducing market impact. His responsibilities also included portfolio hedging, risk monitoring and onboarding portfolio managers.
Prior to Brookfield, Van Hassel spent more than eight years as an International Trader at Spark Investment Management. There, he traded across global equities and derivatives and helped build the firm’s European trading capabilities, including establishing broker relationships and trading infrastructure. His work also covered securities lending, transaction-cost analysis, algorithmic execution and market structure.
Earlier in his career, Van Hassel was an Emerging Markets Trader at Mirae Asset Global Investments, executing cash equities and derivatives across emerging markets and working on best execution, transaction-cost analysis and trading technology.
He previously worked as a trader at Exis Capital Management, executing equities, futures and commodities and supporting portfolio managers with market and position analysis.
Dragonarch Partners is a New York-based investment firm with a relatively limited public profile. Publicly available information does not currently disclose the firm’s assets under management.
As institutional participation in digital assets grows, the way firms trade is starting to change. Execution quality, access to liquidity and the separation of credit and execution are becoming increasingly important. Brandon Mulvihill, Co-Founder and CEO of Crossover Markets, spoke with Traders Magazine about what institutions should look for in a trading venue, the rise of prime brokerage and how he expects the crypto market structure to evolve.
Brandon Mulvihill
Fee-inclusive execution costs are only one measure of venue quality. What other factors should institutional firms prioritize when evaluating where to trade digital assets?
True institutional buy-side clients are extremely focused on total cost to trade, which includes execution cost as well as cost of capital. The use of prime brokers is increasingly becoming the headline story, notably as bank-side custody comes online. The ability to trade across multiple liquidity points and net settle in one location brings enormous capital savings. At Crossover, we don’t believe any institution should bind themselves to a vertically integrated model that mandates credit and execution are married together. CROSSx wins trades based solely on the merit of our pricing and execution quality, without ever holding clients captive.
Many crypto exchanges combine custody, execution, market making, and listing services under one roof. What structural conflicts can that create for institutional participants?
The vertically integrated model combines all clients into one liquidity pool, mixing institutions and retail, liquidity providers and liquidity takers. As a result, liquidity providers can price retail and also take liquidity in competition against them. These models also hold clients captive, introducing unnecessary risk. On October 10, 2025, we watched a dislocation event where several crypto exchanges went down and liquidated clients at prices the exchanges themselves determined unilaterally. Because those venues marry credit and execution, institutions couldn’t manage risk as they would in other asset classes. That event accelerated a migration to the OTC model — separating credit, clearing, and execution — more analogous to the global foreign exchange model.
How do fairness, transparency, and low latency translate into measurable improvements in execution quality for buy-side firms?
Nearly all 110+ institutions trading on CROSSx are sponsored by a prime broker such as Ripple Prime or BitGo Prime. This model allows clients to buy BTC/USD on CROSSx and sell elsewhere, or vice versa, with no obligation to trade on our platform. Every trade CROSSx wins is based solely on pricing and execution quality — currently around 1.5 to 2 million trades per month. CROSSx matches trades in single-digit microseconds, meaning makers can see hundreds of price updates in the time a crypto exchange updates once. We also utilize a proprietary Smart Order Matching execution model, delivering Best Bid Offer based on price, size, and time, while re-ranking liquidity providers in real time based on fill ratios, response times, and market impact. Slow response times carry an economic cost on CROSSx that most exchanges don’t reflect.
As institutional participation in digital assets grows, do you expect market structure to evolve toward more specialized service providers rather than vertically integrated exchanges?
As regulatory clarity becomes tangible and bank-side custody grows, we will see the maturation of prime brokerage put enormous pressure on execution venues to win market share on the merit of their performance rather than by holding clients captive. Costs will compress significantly — Wall Street-level institutions mandate the lowest cost to trade, and we anticipate trading costs in digital assets will fall by an order of magnitude as volumes skyrocket. Crossover is uniquely positioned for this environment. Because we don’t hold client money and are never counterparty to trades, our operational costs are low and relatively fixed. CROSSx can do 10x or 20x current volumes without material budget increases — unlike crypto exchanges that need to generate hundreds of dollars per million to run institutional business lines.
What changes would you like to see in the way firms measure and report best execution, particularly as regulators place greater emphasis on execution quality?
It is important to first highlight that institutional demand is already forcing improvements to best execution. As suggested previously, if an institution has a prime broker, then by definition the execution venue had better perform, otherwise that institution has zero obligation to ever trade on a particular platform. Decoupling credit from execution is the healthiest move the market can make when discussing best execution.
Looking ahead, what characteristics will distinguish the venues that attract long-term institutional liquidity from those that struggle to compete?
Scale. Simply put the supply chain, notably with respect to an execution venue, must demonstrate that its platform can scale with respect to sales, liquidity analytics and management, throughput, and trade executions without placing burdens on operational costs. Brokers, or crypto exchanges, as we call them in digital assets, are coming under serious pressure. Because these institutions hold client money and contain credit risk, the cost to run these business lines is only going to grow as regulations come to fruition globally. Our belief is that the majority of crypto exchanges will either retreat in their global ambitions or they will retreat from the institutional world and focus on their core competency of retail trading. Offering a platform that is run from the cloud and delivered via a mobile app or WebSocket API is a retail offering and not something that was ever going to truly compete for Wall Street level institutional flows.
The image for this article was generated using AI.
Parameta Solutions, the data and analytics division of TP ICAP Group, and Intercontinental Exchange, Inc. (NYSE: ICE), one of the world’s leading providers of financial market technology and data powering global financial markets, have announced an expanded agreement to distribute Parameta’s global over-the-counter (OTC) market data through the ICE Consolidated Feed.
Much of the world’s trading activity takes place over the counter (OTC), where transactions are negotiated directly between counterparties, and transparency into pricing and liquidity can be limited.
The expanded relationship allows ICE to offer Parameta’s differentiated OTC market data across asset classes including linear and non-linear rates, inflation, fixed income, credit, FX, FX options, money markets and energy. Sourced from the world’s largest interdealer broker, including leading brokerage brands ICAP, Tullett Prebon and PVM, the data enhances visibility into OTC markets alongside the exchange-traded data already available through ICE’s consolidated feed.
The ICE Consolidated Feed aggregates content from 600+ data streams in a normalized format. Used by banks, asset managers, hedge funds, ISVs and redistributors, the ICE Consolidated Feed delivers a broad range of global information with multi-asset coverage, including equities, derivatives, fixed income, foreign exchange, money markets, commodities, energy and ETFs.
ICE clients can seamlessly access streaming pricing and market intelligence through a single, normalised data feed, providing a more complete view of market activity and price formation. Parameta’s data is delivered through existing workflows, reducing integration complexity to help enable more informed trading decisions.
“Many firms want a clearer and more complete view of markets beyond the exchanges, but without adding complexity to their data infrastructure,” said Lisa Ward, Head of Channel Distribution at Parameta Solutions. “By combining the depth of liquidity and market expertise within TP ICAP Group with ICE’s global distribution capabilities, we are making hard-to-source OTC market data more accessible, usable and actionable. Alongside ICE’s exchange-traded data, this provides a more holistic view of market activity and supports clients in making better-informed trading decisions.”
The expanded distribution relationship reinforces both companies’ commitment to improving market transparency and providing clients with flexible access to high-quality market data across both OTC and exchange-traded markets.
Nasdaq (Nasdaq: NDAQ) has announced that it has completed its acquisition of Dasseti, an AI-powered due diligence and monitoring platform for investment consultants, institutional investors, and asset managers. Dasseti’s capabilities will be integrated into Nasdaq eVestment™, extending the platform across the full manager research, due diligence, and monitoring lifecycle. First announced on July 23, 2026, the acquisition builds on a relationship that began with an early-stage investment by Nasdaq Ventures in 2022. Financial terms were not disclosed.
Institutional teams operate across an expanding universe of managers, strategies, and asset classes, particularly in private markets, where data is less standardized and reporting requirements are more demanding. Nasdaq eVestment operates at the center of that universe, connecting roughly 4,800 contributing asset managers with more than 1,200 asset owners and intermediaries, powering more than $90 trillion in assets under management across 112,000+ products in 109 countries. Additionally, private markets coverage now includes more than 16,000 managers and 95,000 funds, all accessible via Nasdaq eVestment, global data providers, and customer relationship management platforms.
Oliver Albers
Dasseti applies AI to the due diligence questionnaires, request for proposals (RFPs), and ongoing monitoring that generate insight on how managers operate. The platform covers 17,000 asset managers and general partners (GPs) representing $34 trillion in assets under management, one of the industry’s largest due diligence and monitoring ecosystems. Integrated into Nasdaq eVestment, those capabilities are expected to accelerate response times and improve data quality – giving consultants and institutional investors a complete path from screening through selection and ongoing monitoring in a single environment, while unifying the RFP, due diligence questionnaire (DDQ), and database management experience for asset managers.
“Much of the due diligence and RFP process still happens outside core research platforms, in a patchwork of spreadsheets, PDFs, and email threads,” said Oliver Albers, Executive Vice President and Chief Product Officer, Capital Access Platforms, Nasdaq. “With Dasseti, we’re bringing AI-powered due diligence and monitoring into Nasdaq eVestment, creating a more connected experience that helps institutional investors move from research to decision-making and ongoing oversight with greater efficiency and confidence.”
CME Group launched E-nano equity index futures on August 24, adding another contract size to its established E-mini and Micro E-mini lineup.
The new futures track the S&P 500, Nasdaq-100, Russell 2000 and Dow Jones Industrial Average and are one-tenth the size of CME’s corresponding Micro E-mini contracts. The E-nano S&P 500 and Russell 2000 have multipliers of $0.50 per index point, compared with $0.20 for the Nasdaq-100 and $0.05 for the Dow.
CME said it introduced the products to increase market accessibility and provide another way for participants to manage exposure to the four benchmarks. The contracts trade 23 hours a day and can be offset against positions in the corresponding Micro E-mini and E-mini futures.
The launch comes as some of CME’s existing micro contracts are recording higher volumes and activity across North American listed derivatives has increased.
According to FIA’s latest monthly data, North American futures and options volume reached 2.31 billion contracts in July, up 28.4% from a year earlier. Futures accounted for 614.5 million contracts and options for nearly 1.7 billion.
Micro contracts build volume
CME introduced its Micro E-mini equity index futures in 2019. Seven years later, the smaller contracts account for a sizable share of trading in its equity index business.
The Nasdaq-100 contract recorded particularly strong growth. Micro E-mini Nasdaq-100 futures ADV reached 3 million contracts, up 159% from July 2025, while Micro E-mini S&P 500 futures ADV increased 27% to 1.1 million contracts.
By then, CME said its Micro E-mini equity index suite had surpassed 2.6 billion cumulative contracts traded, including more than 1 billion contracts each in Micro E-mini S&P 500 and Micro E-mini Nasdaq-100 futures.
Smaller contracts across U.S. markets
Smaller versions of established derivatives are not limited to CME.
Cboe Global Markets lists Mini-SPX, or XSP, options based on one-tenth the value of the S&P 500 Index. The contracts are cash settled and European style and offer a range of expirations.
Cboe data show XSP volume of 262,374 contracts and open interest of 757,813 as of August 31.
Source: Cboe
The exchange also offers Mini VIX futures at one-tenth the size of standard VIX futures. Cboe’s product lineup goes smaller still with Nanos S&P 500 Index options, which are one-hundredth the size of XSP options.
At CME, meanwhile, the range of smaller contracts extends beyond equity indexes. The exchange has proposed a 10-Barrel WTI crude oil future at one-tenth the size of its existing Micro WTI contract.
That product had been due to launch alongside 24/7 trading in WTI crude oil and gold futures on August 30. CME said on August 24 that the launches had been postponed pending regulatory review and that an updated date would be announced.
The E-nano equity futures did go live on August 24, giving CME three different contract sizes across the same four U.S. equity benchmarks.
The difference in exposure is substantial. Using an S&P 500 level of 7,000, CME puts the notional value of an E-mini S&P 500 future at $350,000. The equivalent Micro E-mini is $35,000, while the E-nano is $3,500.
The same progression applies to the Nasdaq-100: $20 per index point for the E-mini, $2 for the Micro E-mini and $0.20 for the E-nano.
By Hitesh Mittal, Founder and CEO of BestEx Research
Hitesh Mittal, BestEx Research
The SEC has proposed repealing the Order Protection Rule and its related rules on locked and crossed market prohibitions1 (together referred to as “OPR” in the rest of the note), two of the foundational components of Regulation NMS. There are arguments for and against the OPR. The strongest argument in favor of repeal is the unnecessary fragmentation it may have created, allowing new exchanges to emerge because, as long as they can attract market makers and establish the best quote, liquidity takers cannot ignore them. The strongest argument against repeal is the potential for locked markets and a less meaningful NBBO.
Both sides have merit in their arguments. But I think the framing of the debate is wrong, and the question worth asking is a different one. What will unwinding OPR actually do to US equity markets?
My answer, in short, is that a repeal of OPR will change the terms of competition among venues far more than it changes the number of them. OPR was the direct reason for one wave of venue creation, the maximize-the-rebate exchanges. It was only the indirect catalyst for the creation of the rest of the venues—the ATSs, SDPs, and some of the exchanges. Venues built around internalization, adverse selection, access-fee avoidance, listing law, trading hours, and whatever tokenization turns into will still have their reason to exist the day after repeal. The genie is not going back in the bottle; we will still have fragmentation. It will only evolve into something else.
That claim only makes sense considered against history, so it is worth reviewing how we got from two exchanges to sixteen, 30 ATSs, and numerous SDPs in the first place.
How OPR let the genie out
The end of duopoly.
With the introduction of OPR, we first witnessed the breaking of the NYSE and Nasdaq duopoly. ARCA, BATS, and Direct Edge all directly challenged the incumbents. This was largely expected and perhaps the intended effect of OPR.
Traditionally, the primary challenge in starting an exchange was attracting order flow, and market makers will show up as long as you have it. OPR changed the game by requiring trading centers to prevent executions at prices inferior to the NBBO. As long as a liquidity provider is willing to quote at an exchange, the takers cannot ignore them. The game therefore became increasingly about attracting liquidity providers.
The maximize-the-rebate strategy (and access fee).
As a result, these new exchanges relied heavily on a maximize-the-rebate strategy. In a competitive environment exchanges generally make 2-5 mills per share net on two sides of the trade. They can do so by charging both the suppliers and takers a fee, or they can do so by offering a rebate to one side and a higher fee to the other side to compensate for the loss and include their margins. To determine who to favor, exchanges study the elasticity of liquidity suppliers and takers—how much more volume can they expect from that side if the pricing is reduced. Since the elasticity of liquidity takers is low (due to the OPR), most exchanges charged the highest fee possible to liquidity takers, and since the elasticity of liquidity providers was very high (they could provide liquidity on any number of exchanges), exchanges offered the highest rebates for providing liquidity.
The playbook, then, was simple. Attract the largest market makers, HFT firms, and broker-dealers to quote on your exchange by offering the highest rebates possible (or even better, an equity stake). Once those firms established competitive protected quotes, OPR ensured that liquidity takers could not ignore them.
But it is important to note what this playbook does not require: order flow, a differentiated matching engine, or a single institutional client relationship. It requires a pricing structure with a high rebate, relationships with the largest market makers and a rule that makes their quotes unavoidable.
An unleveled playing field.
Rebates, however, did not solve the adverse selection problem, which HFT market making firms care about equally. Exchanges “innovated” by creating increasing levels of asymmetry between their largest customers, the HFT firms, and everyone else. They offered volume tiers, proprietary data feeds, increasingly sophisticated order types, and faster access. HFT firms also invested heavily in low-latency technology to detect when the market was about to move and cancel their quotes before potentially price-moving orders could trade against them. While the same advanced functionality was offered to everyone, only the largest HFT firms with tens of millions of dollars budgeted annually could make the most optimal use of it.
Low-price liquid stocks create long queues and invite inverted exchanges.
Anotherdistortion created by OPR was artificially large spreads for low-price, highly liquid stocks. OPR required2 a harmonized tick size across exchanges, which was set to one penny for all stocks trading above $1. For example, large-cap stocks trading around $5 traded at 20 basis points of spread while similar large caps at higher prices traded at roughly 3 basis points. Access fees3 alone added another 12 basis points of effective cost on those low-price names.
Queues at the best price became very long, so a liquidity provider joining the back of the queue had little realistic chance of trading. Inverted exchanges were born to solve this problem. By paying the liquidity taker rather than charging it and by charging the suppliers they reduced the queues giving providers a chance to fill quickly and lowered effective spreads for the taker. Note that while OPR requires harmonization of tick size, there is no proposal for the marketplace to freely determine its own tick size and tick sizes are slated to reduce to half a penny for liquid stocks by November 2027.
High access fees chart the course for ATSs and SDPs.
High maximum access fees, coupled with OPR, motivated institutional broker-dealers to innovate their business models. Institutional broker-dealers invested heavily in building their own ATSs with lowering of routing costs as one of the major motivations. Most large broker-dealers modified their execution algorithms to take within their own ATSs first. They simultaneously solicited HFT firms to provide liquidity within those ATSs. While only a few ATSs existed prior to Reg NMS, and were largely buy-side-to-buy-side crossing networks facilitating large transactions at the midpoint, most ATSs post-Reg NMS became internalization mechanisms for broker-dealers with average trade sizes similar to exchanges. Many of these ATSs today have even larger market share than exchanges.
With institutional broker-dealers becoming extremely cost conscious, HFT market making firms also sensed the opportunity and started offering their liquidity for “free” in the form of unregulated venues called single-dealer platforms (SDPs). Broker-dealers simultaneously invested in building smart order routers (SORs) to lower their routing fees. Most SORs were configured to take first in their own ATS, then inverted exchanges, then SDPs, then other ATSs, and only then regular maker-taker exchanges. And that routing hierarchy became the norm.
Retail flow leaves exchanges entirely.
While wholesalers existed before the Reg NMS era, the race for retail flow became even more heated post-Reg NMS with technological advancements, increased fragmentation and increased synergies among various kinds of flows these wholesalers operated. Retail brokers earned rebates on both limit orders (at exchanges) and market orders (in the form of payment for order flow) and zero commission trading was born. Exchanges became the last stop for both institutional and retail liquidity-taking order flow.
Addressing adverse selection with innovation.
While exchanges became the liquidity of last resort, OPR ensured that their quotes could not be ignored, so the distinct advantage they held over ATSs and SDPs was that exchanges were the only type of venue where prices could not be traded through. On the other hand, the excessive number of venues and being last place in the routing table meant that liquidity provision on exchange came with high adverse selection, for both liquidity providers and institutional broker-dealers.
IEX was one of the first to innovate in the exchange space to address the adverse selection issue, roughly a decade after Reg NMS arrived. Its best-known innovation is a 350-microsecond speed bump. HFT firms had spent enormous amounts of money building technology that allowed them to identify when a quote was becoming stale and cancel before an incoming order could pick them off. IEX, with its delay and integrated signal, was able to lower adverse selection for liquidity providers. Other exchanges, for example Nasdaq with MELO, have since created similar delay mechanisms for the same purpose.
More recently, ATSs have also started segmenting liquidity by grading liquidity taker flow to allow liquidity providers to optimize the tradeoff between fill rate and adverse selection. Trajectory crosses have also become increasingly popular as they cross orders at interval VWAP prices, thus minimizing adverse selection. Pre-Reg NMS there were three dark pools operating as ATSs, and today there are roughly thirty, each with customizable segments of liquidity and at least eight running their own trajectory crosses. New exchanges pursuing a maximize-rebate strategy also continue to appear, with MEMX and MIAX as the most recent examples.
This is the section of the history that matters most for the forecast. While OPR may have started it, many of the later innovations were introduced to address adverse selection, and they don’t necessarily depend on OPR to draw order flow anymore. Innovations such as speed bumps, segmented pools, and trajectory crosses are all just as valuable the day after a repeal as the day before.
What repeal actually changes
In my opinion, the biggest direct change we can expect if OPR is repealed is in the elasticity of liquidity takers and liquidity providers, which will lead to different incentive structures. Liquidity takers without obligation to route to the best-priced exchange (but with a very high access fee) will now have the ability to lock a quote.
With no obligation to take liquidity at an exchange even when it is quoting the NBBO, exchanges will have to work harder to win order flow. If there are two exchanges, one with a heavy maker-taker model and the other with a low-fee model, a liquidity taker can simply provide at the low-fee venue and lock the quote at the expensive one. For example, say Exchange 1 is at NBBO alone with a $10.10 bid and $10.11 offer 100×100. Exchange 1 charges 30 mills per share to remove liquidity. So the price to buy at $10.11 is really equivalent to buying at $10.1130. An algorithm willing to buy 200 shares at $10.11 may choose to post 200 shares at Exchange 2 which offers a fee-fee model at 1 mill per share and thus trying to buy at $10.1101 adjusted for the fee. From a NBBO perspective, it will appear as a locked market (NBB of $10.11, NBO of $10.11 and midpoint of $10.11), on a cost plus basis it is a $10.1101 – $10.1130 market.
Locked markets will thus reduce the spreads adjusted for the access fee and rebate (or make it zero unadjusted for spread) and will increasingly be a norm as opposed to a rule violation. With the liquidity takers having the ability to choose when not to take liquidity rather posting the order at different exchanges at the same price, the power of making choice will shift from liquidity suppliers to liquidity takers. And with the choices shifting so will the pricing of exchanges.
The rebate-funded exchange loses its business model. A venue whose only asset was an unavoidable protected quote now has to answer the question it was never required to answer: why should flow come here? Some will find an answer. Some were never designed to have one.
Move to a fee-fee model from a maker-taker model. Absent the OPR, it is likely that exchanges move to a fee-fee model which will allow for a much lower fee. Note that the SEC has already approved access fee reduction which is slated to go live in November 2027. It is unclear whether that is needed absent OPR. Europe is the closest thing we have to evidence. European markets have no OPR but do have fragmented markets and for most major European exchanges maker-taker is not the prevalent model.
HFT Market Making revision. For the largest HFT firms, who invested heavily in technology and rely on rebate mechanisms for providing liquidity, the dynamics are very likely to change. The rebate was compensation for adverse selection borne on venues sitting last in the routing table. Only the fastest HFT firms benefit from it, those who have built an edge minimizing adverse selection with ultra low latency infrastructure and thus have the ability to retain the rebates. With no obligation to trade at their quoted prices the order flow will likely change. And with fee changes on exchanges, that will change further. How many of those strategies survive and how many get adjusted remains a question. Perhaps it will mean that we see less liquidity on exchanges and thus wider spreads. Or perhaps with reductions in fees, the order flow on exchanges becomes less toxic, leading to more competition between HFTs and thus narrower spreads. Only time will tell and it will likely happen in a sequence of events as opposed to a single change.
The routing hierarchy re-sorts, and ATSs have to re-justify themselves. If taking on an exchange gets meaningfully cheaper, the fee-avoidance ranking that put maker-taker venues last stops being the obvious choice. While that may have been the primary reason for a number of ATSs to originate, now that they are there, it is unclear that repeal does anything to that. Broker dealers will still be incentivized to target their own ATSs for taking liquidity but perhaps there will be less pinging of other ATSs (on the far side) before they route to exchanges if the access fee is reduced on exchanges.
Peg Mid, Peg Near, Peg Far in locked markets. The NBBO is load-bearing far beyond Rule 611. Most of the ATS flow relies on NBBO pegging—whether pegging to the near, far or midpoint price. The repeal of OPR as proposed will lead to extended periods of locked markets with orders pegging near, far and midpoint all pointed to the same price. If we learn from European markets, some ATSs may start referring to the primary market’s BBO and ECNs/exchanges may take a composite price based on the primary market and their own order book—because referring to one market will not lead to locked quotes. Or perhaps some ATSs will use NBBO peg when quotes are locked and the primary market BBO when quotes are not locked. Will this lead to gaming of midpoint orders when the true midpoint is different from the primary midpoint? Could that mean primary markets will increase their market share (as is the case in European markets)? From our experience building and operating algorithms for EMEA and Canadian markets, this is an area that requires a lot of attention from an algo and SOR design and TCA perspective for proper error handling and execution.
We do experience locked markets in US equity markets today but they are largely due to race conditions and disappear quickly. Most ATSs either allow opting out of trading when markets are locked. We opt out, and we pause trading in our algorithms when markets are locked. For other markets (e.g., Canada, EMEA) where occurrences of locked markets and crossed markets are frequent and, more importantly, expected, we use primary market quotes for the period that the quote remains locked or crossed.
As algorithm behavior adjusts, TCA will need to adjust as well. In the presence of locked and crossed markets, what is price improvement? While calculating arrival price do you take the quote prior to a locked or crossed market midpoint? Or simply take primary market midpoint? There will be many questions to answer in order to define a new standard of measurement.
Venues do not need OPR to keep multiplying
While OPR may have directly or indirectly been the reason for the fragmentation in the US equity market, the question is whether its repeal will reduce this fragmentation. Broker-dealers, exchange operators, and market makers have spent years and hundreds of millions of dollars building network effects. They will work hard to maintain their edge and to adjust in light of new regulation and of course they will continue to lobby to shift regulation in their favor. But the more direct evidence that repeal will not consolidate the venue landscape is that the most recent wave of venue creation has had nothing to do with OPR in the first place.
Consider primary listings to start. The Texas Stock Exchange has made its primary differentiation not about trading at all, but about using Texas’s corporate law. Texas’s corporate law is favorable to the issuer and “pro business” even if a company is dual listed. NYSE and Nasdaq have responded by rebranding their inverted exchanges, which had low volume to begin with, and reincorporating them in Texas as NYSE Texas and Nasdaq Texas. For another example, the exchange 24X launched with its differentiation defined by trading 24 hours a day, and Nasdaq followed by acquiring Level ATS to help it expand into 24-hour trading. And finally, there is also considerable buzz about security tokenization, rumored to be a motivation behind OPR’s repeal rather than fragmentation (since repeal of OPR is a necessary condition for operating a tokenized exchange). And this could be where the next wave of new venues actually comes from.
So, what about the genie?
The impact of regulation as important as Reg NMS is never immediate. It takes its own course, through a chain reaction of adjustments, and the second-order effects are usually larger than the first-order ones the rule was written to produce. Reg NMS with OPR has arguably been the most influential regulation in the largest securities market in the world.
Its repeal will perhaps be even more consequential because the last two decades of infrastructure have been built around it. There will be some good and intended effects—exchanges will be forced to answer what value they bring to the table beyond simply offering a protected quote from a fleeting market maker. But there are likely to be unintended effects unfolding as well.
Take European regulation MiFID as as an example. The European Union’s MiFID II framework intended to curb dark trading and force transactions onto public, transparent exchanges, but it unintendedly triggered a fragmentation of liquidity as traders shifted from traditional dark pools into alternative, opaque venues like dealer-owned systematic internalizers. Both anticipated and unanticipated effects have emerged.
While the bar to start a new exchange will surely be higher, no retail broker or institutional broker trades only on exchanges. The fragmentation outside the exchanges is at least an order of magnitude higher than on exchanges. The venues that already exist will continue to defend the network effects they have already built and perhaps increase their territories into other areas such as 24-hour trading, tokenization, and other business models we can only imagine after the immediate reaction from the regulation takes hold. For this reason, I think fragmentation is more likely to change its form than to go away—the genie finding a new home outside the bottle, if you will—though cited as the primary objective for repeal.
Twenty years ago the SEC took a bold step to tie the markets together with Reg NMS and has spent the last twenty years fixing the imperfect aspects of the market one by one, never sacrificing the sanctity of the NBBO. Changes have included adding Self Help rules and testing procedures to ensure that one bad exchange cannot bring down the ecosystem, improving the quality of the NBBO by reducing odd lots for highly priced securities, improving the latency of SIP, reducing the access fee and thus lowering the cost-adjusted spread, reducing the tick size for liquid stocks. All of these changes were measured and deliberate. Repeal of the OPR will be far reaching, perhaps in both intended and unintended ways.
At BestEx Research, our answer to fragmentation has never depended on the protected quote, and it will not depend on its absence. We will continue to observe and act as market structure evolves, adjusting our strategies and keeping you abreast of our findings.
Footnotes:
1SEC has proposed rescinding Rule 611 (the Order Protection Rule or trade-through rule) and Rule 610(e) (the prohibition on locked and crossed markets) under Regulation NMS. They are related—Rule 611 prohibits exchanges from trading at a worse price than another exchange displaying a better price, and locked and crossed markets prevent them from posting a price if liquidity at the same price or better is available at another exchange. I refer to these rules together for the rest of the paper.
2Rule 612, as part of Reg NMS, banned quoting in increments of less than $.01 for stocks with price >$1.
330 mills of access fee in a roundtrip is equivalent to 60 mills, which on a notional price of $5 is equivalent to .12% or 12 basis points.