


It is not news to say that the global health crisis has rocked financial markets. But when we go beyond the daily swings in price movements, what information can help traders better adapt to current market conditions? LiquidMetrix will offer a series of insights derived from our data and analytics.
In the last few weeks we have been looking at the changes in demand for liquidity since the global health crisis rocked financial markets. The focus has been on using the LiquidMetrix Liquidity Index to measure the rate of change in the number of shares quoted at different price levels as an “indication of interest” (using the term broadly) in executing trades.
Here we ask a question about another aspect of sourcing liquidity. Has there been a shift in where shares have been traded among different types of execution venues in the last six weeks? The question is important because of its potential impact on order routing. Brokers and Exchanges are obligated by Best Execution to provide the best price for their clients. That means the best price available when they receive the order. When an order is routed to a trading venue it goes into a queue waiting for execution usually based on the time that the order is received. If the queue is long because the order was not routed optimally, there may be a time delay during which the price may change before the trade is executed. The modern stock market is made up of several “sub-markets”. These are the different types of venues (Continuous “Lit” markets, Dark Pools, Market Makers, etc.) available for trading. A broker’s skill in order routing to the right venue and quickly finding the liquidity they need can be the difference between small price improvements or losses.
While small price improvements can appear to be insignificant for individual trades, mere fractions of a penny, an inefficient order routing process adds up to large costs over time. This is particularly true for institutional traders. A typical medium sized institution might execute 25 billion in traded value over the course of a year. A one basis point improvement in order routing equals a cost savings of 2.5 million dollars.
To examine shifts in where liquidity was found during the health crisis, we divide types of trading venues into 4 groups: (a) Continuous Trading Venues. These are the traditional exchanges as well as ATS/MTF trading venues that maintain a continuous order book; (b) Dark Pools; (c) Auctions such as the Opening, Closing or Mid-Day auctions; and (d) Off-Book transactions done between an investor and a market maker.
First, let’s see what the level of trading activity has been over the past 6 weeks in Europe and North America. We look at this in 2 ways, both in absolute shares and as an indexed value that allows us to easily see the rate of change in shares traded across all types of trading venues since March 2nd (Figures 1 & 2).
Figure 1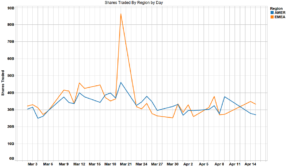
Figure 2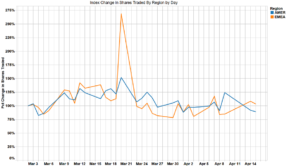
There is a large outlier day on March 20th in Europe. This was the day that European Central Banks injected a massive economic stimulus into their economies[1]. If we remove that day as a datapoint, the day by day change in shares executed (Figure 3 below) shows that the amount of shares traded has been in a band ranging from approximately 20% below the March 2nd start date (just after the beginning the health crisis) to approximately 40% more than the baseline date and has gradually retrenched to overall trading volumes close to those of March 2nd. In general, trading volumes have been higher in North America relative to the baseline. In the last few weeks, EMEA has usually had lower volumes than the index start date.
Figure 3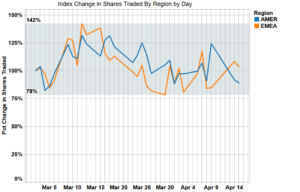
[1] The LiquidMetrix Liquidity Index reflects the change in the number of shares available at different price points. Increases or declines in liquidity are not the same as price movements but reflect the degree of confidence (and hope!) traders have that the price accurately represents the valuation of the stock. This confidence is reflected by their willingness to trade at a particular price. The decline in liquidity (shares offered for bid or ask) in March was an indication of the levels of risk and uncertainty around the stock price. The uptick seen in the last week signifies a sentiment that “this is not going to be as bad as we feared” and volume has come back to the market (whether this is premature remains to be seen).
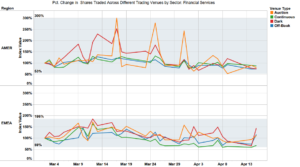
Given the variations, both higher and lower in trading volumes, has there been a shift in where trading has occurred for stocks in different industry sectors? Figure 4 below spotlights the Financial Services sector[1], the largest industry sector in terms of trading volumes. In the first few weeks of the period (i.e. the first 2 weeks of March), there is increased usage of both Dark Pools and Auction facilities in both Europe and North America. In North America, however, the relatively slight uptick in volumes on continuous markets quickly moved back to baseline levels of volume. In contrast, after an initial increase in trading volumes at the beginning of the crisis, trading volumes on continuous markets in Europe are down about 30% from their baseline levels.
Figure 4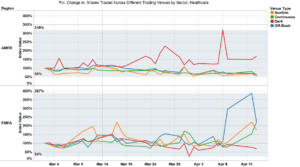
This can be contrasted to the behavior in the Healthcare sector (Figure 5 below). In North America, there has been a clear increase in trading healthcare stocks through Dark Pools. All other types of trading venues are still trading less shares in Healthcare stocks than they did on March 2nd. In Europe, by contrast, the Healthcare sector has not seen a similar dramatic shift. There has been a jump in Off-Book trading in the last week, but it is too soon to label it a trend.
[2] ©2020 Morningstar. All Rights Reserved. The information contained herein: (1) is proprietary to Morningstar and/or its content providers; (2) may not be copied or distributed; and (3) is not warranted to be accurate, complete or timely. Neither Morningstar nor its content providers are responsible for any damages or losses arising from any use of this information. Past performance is no guarantee of future results.
Figure 5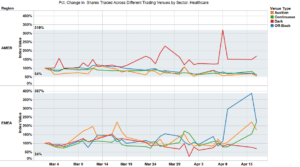
There is always some discussion about the value of Dark Pools (personally, I am a big proponent). So, it might be interesting to look at Dark Pool venue usage over the past 6 weeks across some different industry sectors in both Europe and the US (see Figure 6 below).
We focus on some key sectors (Financial Services, Energy, Consumer Cyclicals and Healthcare. In North America, there is a large increase in Dark Pool trading for the weeks immediately following March 2nd for Consumer Cyclicals, Healthcare and Energy stocks. This has subsided in the last few weeks, but shares traded in Dark Pools are still above the baseline trading levels of March 2. The exception is the Financial Services sector which over the last few weeks has less trading activity in Dark venues compared to the index start date.
There is a similar uptick in Europe for the use of Dark Pools at the beginning of the period. However, it was not of the same order of magnitude and moved back sooner to normal levels of trading activity.
Figure 6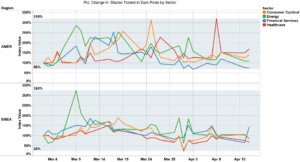
We have seen that there may be changes in where liquidity resides, and trades are executed with extreme market volatility like that brought on by the global health crisis. The perceived risk associated with different economic sectors can lead to traders modifying trading strategies such as the increased use of Dark Pools. Timely information on shifts in liquidity movement among venues can help optimize order routing and save clients money during periods like this.
The views represented in this commentary are those of its author and do not reflect the opinion of Traders Magazine, Markets Media Group or its staff. Traders Magazine welcomes reader feedback on this column and on all issues relevant to the institutional trading community.