


Back when humans had to calculate indexes by hand, the Dow was built to include one share of each ticker. That meant all you had to do was add up share prices and you had your index. That also seemed to encourage companies to keep their stock prices closer to optimal trading levels, whichweve shownseems to happen when the stock naturally trades between one and two ticks wide.
Stock splits have become unpopular as markets have automated.
Data shows that since the turn of the millennium, stock splits have become decidedly unpopular.
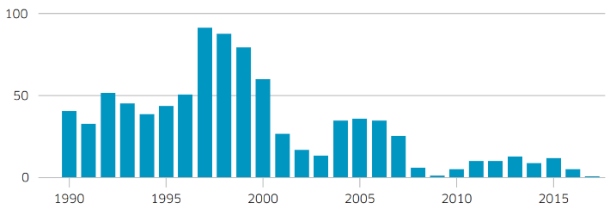
Back in the 90s it wasnt uncommon for 50 stocks (or 10%) of the S&P 500 to split (Chart 1). This helped keep stocks in a relatively consistent price range (Chart 2) which in turn maintained more consistent tradability characteristics across the index.
However, since the credit crisis the number of stock splits per-year has been closer to 10, just 2% of all tickers per year, despite the index rising more than 200%, which would triple the price of an average un-split stock.
Chart 1: Number of stock splits annually by S&P 500 companies
Average stock prices have risen as stock splits have declined
Not surprisingly, the lack of stock splits has caused average stock prices to rise.
These days around one-third of S&P 500 companies are over $100 per share-a level whereweve shownthat even the most liquid stocks start to trade more than one tick wide.
In fact, the simple average of stock prices is now around $100 per share, thanks in part to 5 stocks trading over $1,000 per share. However those high priced stocks also need to trade fewer shares to trade the same value, which tends to reduce their ADV for thesame notional liquidity. As a result the trade weighted average price:
- Of the S&P 500 is currently closer to $74
- Of all stocks is around $49
- Excluding ETFs, the trade weighted average of all stocks is around $44
Chart 2: Almost one third of S&P 500 companies today have prices over $100 per share
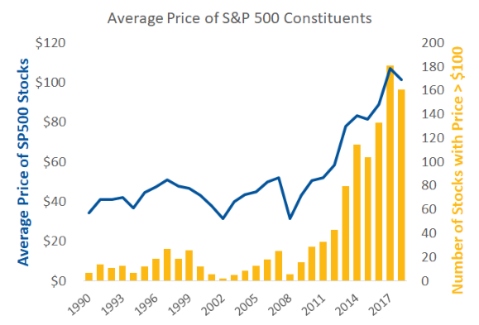
Source: Nasdaq Economic Research
Its also interesting to see the change in composition of the S&P500. Back in 1990:
- 80% of its stocks were priced below $50 per share-that number is now just 27%
- There were no stocks over $200 per share, there are now 65 stocks
Chart 3: Change in price composition of the S&P 500
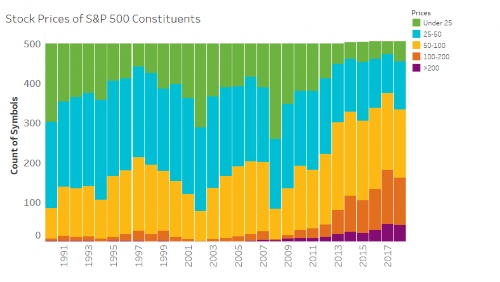
Source: Nasdaq Economic Research
For traders, this is important. As we have shown in many recent post, the one-size-fits-all rules of Reg NMS affects tradability of stocks:
- As prices rise round lots become too large for many traders, so the order book increasingly fillsin with odd lots
- Conversely, as prices fall, one-cent spreads become too large (in %), leading to unusually deep queues, slower fulfillment andmore invertedand mid-point trading
- In both cases,spreads actually widenincreasing the costs of trading.
For portfolio managers and brokers it also distorts commission allocations. Although because brokers bundle commissions, investors dont see the economic cross-subsidy given to support research and trading in the highest priced stocks, because commission spend is based on all shares traded.
Although high-priced stocks might look good to management, they arent great for investors. Thats because they cause a whole lot of distortions, from limiting the ability to allocate stock compensation, to increasing the risk of a single round lots or options contract, increasing costs for investors and distorting trading economics for brokers. To address the trading issues, weve called for intelligent ticks inTotalMarkets, but an even better solution is right-sizing stock prices.